
Driving Green
by William Chiu Suppose you're in the market for a new car. With the average gasoline price hovering around $3.00 per gallon, buying a hybrid vehicle might seem like the best way to go. Sure, the price of a Toyota Prius or Honda Civic Hybrid might cost more than their gas-guzzling counterparts, but the gas savings and tax credits offset the "green premium." Right?
Think again. Reuters reports that, despite sharply increasing gasoline prices, many hybrid vehicles are staying on car lots a lot longer than expected. And Kiplinger shows that, even in the course of five years, buying a hybrid vehicle might actually be more expensive than buying the gas-guzzling equivalent.
Suppose you want to buy a hybrid and you're going to give it to your son or daughter after five years. You should purchase a hybrid vehicle if and only if the benefits outweigh the costs. The benefits of a hybrid over a non-hybrid include an end-of-year $2,000 tax credit and gas savings accrued over the five years. The hybrid’s costs include an extra $5,000 up-front at the dealership.
We will assume gas sells for about $3.00 per gallon for the next five years, and that you will drive about 12,000 miles per year. If your traditional, non-hybrid car gets 25 miles per gallon and the hybrid will get 20 more miles per gallon, is it worth it to purchase a hybrid?
The cash flows from purchasing the hybrid vehicle rather than the gas-guzzling equivalent are shown below:
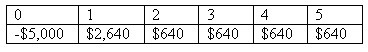
At first glance, the hybrid saves you $200 over five years, but that is deceptive because it does not account for the time value of money. If you could earn a 10% annual return investing in a high performing stock index fund, the tax credit and gas savings are worth less than what they appear. In order to calculate the hybrid’s net benefit, we must consider the time value of money, which says $1 today is worth more than $1 tomorrow, because $1 today can be immediately invested to earn a return.
The following shows the present values of the cash flows from purchasing a hybrid vehicle rather than a non-hybrid.
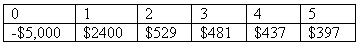
Net Benefit = -$756
Under these assumptions, you are better off buying a traditional car than you are buying a hybrid.
1. What if you drove 16,000 miles per year; is it worth it to buy the hybrid vehicle?
2. Driving a traditional gas-powered car imposes a negative externality (pollution) on the community. How do externalities affect your decision making?
3. Currently, there are only a few hybrid vehicles available in the market. If automakers such as Honda, Toyota, Ford, General Motors, Volkswagen, and Daimler-Chrysler realize that there are unexploited profits to be made in the hybrid vehicle market, how would this affect the premium you pay for a hybrid? If the "green premium" decreases, how would this affect the net benefit of buying a hybrid?
CLICK HERE FOR THE HYBRID CALCULATOR (EXCEL)
Topics: Finance, Externalities, Time value of money, Invisible hand, Cost benefit analysis
Labels: Cost-Benefit Analysis, Finance
2:09 PM | Permalink | Comments |
Assign Aplia Reading
![]()
![]()

 Subscribe to this blog
7 Comments:
At 11:29 AM, May 06, 2006, Jeff Shepley
said…
Jeff Shepley
said…
The assumption that "you could earn a 10% annual return investing in a high performing stock index fund," seems to be the ubiquitous standard by which all generic investment hypotheticals are measured. My question is, how realistic (or risky) is this assumption for a small, individual investor and if it is the nearly fail-safe return rate, where can I find the funds that consistently perform at this level?!
At 12:16 AM, May 07, 2006, Chris Buzzard
said…
Chris Buzzard
said…
Very good question! Whenever you conduct financial analysis it is important to question whether you are using the right model and assumptions. You’re right, 10% seems to be the default annual return in finance textbooks and theoretical examples. Oddly enough, professors many years ago argued that was unreasonably high, then during the 90s many professors argued that it was too low. I guess your opinion depends on the context of your situation. So, let’s examine this assumption a little.
According to Ibbotson & Associates’ Stocks, Bonds, Bills, and Inflation: (Valuation Edition) 2005 Yearbook, the following security types had these corresponding returns over the period of 1926-2004:
Small-company stocks: 17.5%
Large-company stocks: 12.4%
L-T corporate bonds: 6.2%
L-T government bonds: 5.8%
U.S. Treasury bills: 3.8%
This shows that over a long investment horizon, a 10% return is very plausible, and almost conservative. A wide range of portfolio combinations of small and large stocks with bonds have historically returned over 10%. Of course, we do not always have the benefit of investing over 80 years.
I pulled annual S&P 500 returns since 1970 for a closer small sample look. In 18 of the past 36 years, the S&P 500 return exceeded 10% and obviously that means that in 18 years it was less than 10%. Summary statistics of these annual returns are: Minimum = -24.3%, Maximum = 35.2%, Mean = 8.9%, Standard deviation = 15.2%. So, the average return is less than 10%, but at 8.9% it is only 0.07 standard deviations below (hardly statistically significant. Two decades exceeded 10% (80s: 11.7%, 90s: 16.1%), while two were less than 10% (70s: 4.2%, 2000s: 0.2%) but realize that the current decade is only halfway through and includes the burst of the Internet bubble and the effects of September 11th.
As of the close of trading May 5th, the S&P500 returned 6.2% this year, which annualizes to about 18%. Of course, no one knows what the rest of the year will look like. All of this suggests that 10% is a perfectly reasonable number to use for such examples, which has the added benefit of being an easy number to work with and understand the present value calculations. Still, it is good to consider alternative inputs to your models. I recalculated the NPVs of this hybrid analysis below over a range of annual returns:
7% -$506.71
8% -$592.81
9% -$675.76
10% -$755.71
11% -$832.82
12% -$907.23
At different times, 10% will seem like a lot or a little, but it is reasonable to assume it as an expected annual return. Hope this helps!
At 8:46 PM, May 07, 2006, James
said…
James
said…
Of course, with the hybrid you will be handing your child a more valuable car in 5 years, other things being equal. Truncating the analysis at 5 years makes the hybrid seem less worthwhile than it would be if you calculated the savings over the car's lifetime.
At 12:04 AM, May 08, 2006, William Chiu
said…
William Chiu
said…
Hi James. You inspired me to "show my work". I attached an Excel spreadsheet to this blog post. All the yellow cells are pre-calculated and the white cells are for you to play around with.
For example, if I planned to drive my car for 10 years rather than 5 years, then the net benefit is actually +$751. Which means I should buy the hybrid car!
In other words, the longer I plan to drive the hybrid before I give it away, the higher the net benefit of choosing the hybrid. All else constant.
Thank you for commenting.
At 11:33 AM, May 09, 2006, Chris Buzzard
said…
Chris Buzzard
said…
Hybrids and opportunity costs
Here is an interesting CNNMoney article about the tradeoffs prospective car buyers say they are willing to make for an extra 5 miles per gallon (MPG). What conclusions about consumer preference can you draw from the survey results?
At 9:59 AM, June 01, 2006, William Chiu
said…
William Chiu
said…
This comment has been removed by a blog administrator.
At 10:01 AM, June 01, 2006, William Chiu
said…
William Chiu
said…
Hi Bob,
You're absolutely right. An ideal NPV calculation would include the resale value of the hybrid. However, as you mentioned, the resale value of a 2005 Toyota Prius in 2010 is unknown at this time.
This is why we avoided the complication, with a simple assumption , "you're going to give it to your son or daughter after five years." Hence the cash flows after year 5 will simply be 0.
Thanks for commenting!
Post a Comment
<< Home