
An iTunes Index for Exchange Rates
by Joshua Gans
This week, The Economist celebrated the 20th anniversary of its Big Mac Index. The newspaper regularly examines how current exchange rates compare to purchasing power parity (or PPP). The price of a standardized commodity that is otherwise locally produced, like Big Macs or Starbucks Lattes, is compared across countries. According to PPP, exchange rates should adjust so that a consumer's purchasing power is the same across countries. Big Mac prices can, therefore, give an indication as to where PPP exchange rates should be.
Of course, Big Mac prices build in the differences in local production costs between countries. For example, the price of beef is lower in Australia than in Japan, and Australian Big Mac prices reflect the lower input cost. Perhaps a standardized commodity that is free of variations in local costs would provide more accurate PPP exchange rate estimates.
Consider individual song downloads on iTunes. Like Big Macs, their pricing is set by a single firm--in this case, Apple. Unlike Big Macs, we can expect that there are no local variations in costs. Apple negotiates with the same music company (Sony, BMG, etc.) for the rights to digital provision of a given song. Hence, any cross-country differences in download prices likely arise from differences in demand.
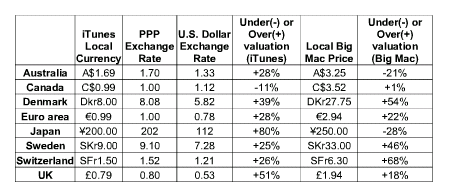
There are many iTunes stores but only nine distinct local currency prices for iTunes downloads. The price of an iTunes download in the United States is US$0.99. The following table shows the price of downloading a song on iTunes in eight additional currencies. The second row shows the PPP exchange rate. This is simply the local price of an iTunes download divided by the American price (US$0.99). For example, iTunes prices suggest a PPP exchange rate of A$1.70 per US$1.00 between Australia and the United States (A$1.69 / US$0.99).
The third column shows the actual dollar exchange rate as of May 22. For example, the actual exchange rate between Australia and the United States was A$1.33 per U.S. dollar. The PPP exchange rate implied by iTunes prices suggests that the Australian dollar is overvalued--that is, it should take more than A$1.33 to purchase an American dollar (since it takes A$1.69 to buy an iTunes download worth only US$0.99 in the United States). The fourth column indicates whether a currency is over (+) or under (-) valued against the dollar according to the PPP exchange rate.
The final two columns show the local currency prices of Big Macs and the under or over valuation of each currency against the dollar when Big Mac prices are used to compute PPP exchange rates. The price of an American Big Mac on May 22 was $3.10.

There are two things interesting to note here. First, apart from Canada, iTunes songs are priced at a premium over the United States in all other music stores. Second, there doesn't appear to be a positive relationship between the PPP exchange rates implied by the iTunes and Big Mac indexes.
In theory, if Apple based its iTunes pricing optimally on long-term forecasts of exchange rates, then the iTunes Index should out-predict the Big Mac Index for exchange rate movements, as it is free of local variation. Only time will tell on that.
1. Apple appears to be practicing international price discrimination in its iTunes pricing. Usually, the richer the country, the higher the price. However, the United States has the highest GDP per capita but the second lowest prices. Can you think of any cost differences that might account for this? Can you think of reasons why the elasticity of demand for paid downloaded music is lower in Japan and Australia than in the United States? Do you think Apple is pricing optimally?
2. Big Mac pricing is probably more flexible than iTunes pricing. Apple may find it hard to change iTunes pricing once it announces a price point. What does this suggest about the relative merits of each as a predictor of PPP exchange rates? Does this suggest that iTunes may face some painful pricing realignment in the future?
3. Can you think of other commodities that might provide appropriate standards for predicting PPP exchange rates?
4. How do the other exchange rates compare using the Big Mac and iTunes instance? For example, calculate the Australia-Japan exchange rate and see how the relative prices for iTunes and Big Macs differ from these.
Joshua Gans is Professor of Management (Information Economics). The iTunes Index was first suggested by him earlier this year on his blog, economics.com.au.
Of course, Big Mac prices build in the differences in local production costs between countries. For example, the price of beef is lower in Australia than in Japan, and Australian Big Mac prices reflect the lower input cost. Perhaps a standardized commodity that is free of variations in local costs would provide more accurate PPP exchange rate estimates.
Consider individual song downloads on iTunes. Like Big Macs, their pricing is set by a single firm--in this case, Apple. Unlike Big Macs, we can expect that there are no local variations in costs. Apple negotiates with the same music company (Sony, BMG, etc.) for the rights to digital provision of a given song. Hence, any cross-country differences in download prices likely arise from differences in demand.
There are many iTunes stores but only nine distinct local currency prices for iTunes downloads. The price of an iTunes download in the United States is US$0.99. The following table shows the price of downloading a song on iTunes in eight additional currencies. The second row shows the PPP exchange rate. This is simply the local price of an iTunes download divided by the American price (US$0.99). For example, iTunes prices suggest a PPP exchange rate of A$1.70 per US$1.00 between Australia and the United States (A$1.69 / US$0.99).
The third column shows the actual dollar exchange rate as of May 22. For example, the actual exchange rate between Australia and the United States was A$1.33 per U.S. dollar. The PPP exchange rate implied by iTunes prices suggests that the Australian dollar is overvalued--that is, it should take more than A$1.33 to purchase an American dollar (since it takes A$1.69 to buy an iTunes download worth only US$0.99 in the United States). The fourth column indicates whether a currency is over (+) or under (-) valued against the dollar according to the PPP exchange rate.
The final two columns show the local currency prices of Big Macs and the under or over valuation of each currency against the dollar when Big Mac prices are used to compute PPP exchange rates. The price of an American Big Mac on May 22 was $3.10.
There are two things interesting to note here. First, apart from Canada, iTunes songs are priced at a premium over the United States in all other music stores. Second, there doesn't appear to be a positive relationship between the PPP exchange rates implied by the iTunes and Big Mac indexes.
In theory, if Apple based its iTunes pricing optimally on long-term forecasts of exchange rates, then the iTunes Index should out-predict the Big Mac Index for exchange rate movements, as it is free of local variation. Only time will tell on that.
1. Apple appears to be practicing international price discrimination in its iTunes pricing. Usually, the richer the country, the higher the price. However, the United States has the highest GDP per capita but the second lowest prices. Can you think of any cost differences that might account for this? Can you think of reasons why the elasticity of demand for paid downloaded music is lower in Japan and Australia than in the United States? Do you think Apple is pricing optimally?
2. Big Mac pricing is probably more flexible than iTunes pricing. Apple may find it hard to change iTunes pricing once it announces a price point. What does this suggest about the relative merits of each as a predictor of PPP exchange rates? Does this suggest that iTunes may face some painful pricing realignment in the future?
3. Can you think of other commodities that might provide appropriate standards for predicting PPP exchange rates?
4. How do the other exchange rates compare using the Big Mac and iTunes instance? For example, calculate the Australia-Japan exchange rate and see how the relative prices for iTunes and Big Macs differ from these.
Joshua Gans is Professor of Management (Information Economics). The iTunes Index was first suggested by him earlier this year on his blog, economics.com.au.
Labels: Exchange Rate, International Economics, Purchasing Power Parity
3:46 PM | Permalink | Comments |
Assign Aplia Reading
![]()
![]()

 Subscribe to this blog
5 Comments:
At 11:11 PM, June 19, 2006, Rob Hayward
said…
Rob Hayward
said…
I think that the relatively low prices in US and Japan reflect the fact that there is more competition there. It is essential that Apple dominate the US market, therefore they are happy to keep profit margins low. I believe that they were relatively late to Japan, therefore, I suspect pricing reflects competitive conditions.
At 11:35 PM, January 23, 2007, Anonymous
said…
Anonymous
said…
Rob: But then, according to your theory, Apple has decided it must dominate the Canada even more, as the price there is the cheapest.
It would also be interesting to compare iTunes cost vs. Automobile cost. Well, to me.
At 5:08 PM, February 02, 2007, Anonymous
said…
Anonymous
said…
I have become very annoyed at this price discrimination. I have thought of ways to arbitrage the songs across the internet, via a means of gifting the music across international borders. With such a variance in prices for a song, particularly between the US and the UK, there is possibly a lot of money to be made. At todays exchange rates, about $5 US difference per album. Thats half another album, ABSOLUTELY RIDICULOUS!!
Compared with the British, Americans are buying 2 getting one free. I don't know what laws there are to stop people from arbitrage, but I think there should be laws to stop price discrimination. Someone please explain why I'm wrong.
At 8:01 PM, March 24, 2008, M.
said…
M.
said…
That's interesting. You can also make a PPP index using the price of The Economist as the basket of goods. I blogged about it here:
Economist Index
And there's a graph of the data here:
Economist PPP Graph
At 4:50 AM, October 18, 2009, Philippe Ory
said…
Philippe Ory
said…
There's on average a 20% VAT (TVA) tax in Europe built in the price. Big government needs its fuel!
Post a Comment
<< Home