
How to Cure Inflation
by William Chiu
Argentina is no stranger to inflation and has suffered frequent periods of devastating inflation since 1945. Despite recent praise from the International Monetary Fund for its economic growth, Argentina currently suffers from a 12.3% inflation rate (compared to only 4% in the United States).
Milton Friedman, winner of the 1976 Nobel Prize in Economics, compares inflation to alcoholism in his PBS series, Free to Choose:
A simple aggregate demand (AD) and aggregate supply (AS) diagram offers great insight into Friedman's analogy and Argentina's inflation woes. The following AD-AS diagram is based on a paper by Professor David Romer. The model might be slightly different from the AD-AS diagram in your textbook.
First, let's look at the assumptions in the model. The aggregate demand curve (AD) assumes that the central bank raises the interest rate in order to combat inflation. For example, if the inflation rate increases, then the central bank will raise the interest rate to reduce consumption and investment, thereby lowering output. The short-run aggregate supply curve (SRAS) represents the inflation rate. The long-run aggregate supply curve represents the output level where the inflation rate has no tendency to change. The long-run aggregate supply curve is often referred to as potential output or full-employment output.
Second, let's look at the short-run effects of an increase in the money supply. In the short run, economists assume that the inflation rate is temporarily fixed. The short run might be a period of 1 day, 1 month, or 1 year. There is no consensus about how long the short run lasts. If the central bank expands the money supply, then the interest rate falls. A fall in the interest rate stimulates consumption and investment spending which shifts the aggregate demand curve to the right from AD1 to AD2.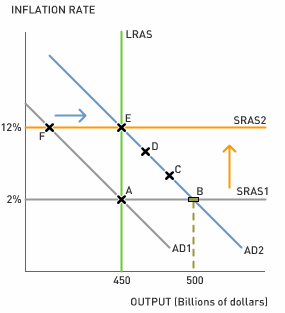 The good effects come first--in the short run, it seems as though the economy has benefited from a higher quantity of money. Output increased from $450 billion to $500 billion which creates more jobs without increasing inflation.
Third, let's look at the long-run effects of an increase in the money supply. The output level at time B is not a sustainable amount of output because $500 billion exceeds full-employment output, which is only $450 billion. An output level above the full-employment output necessarily means that resources in the economy are being over-utilized. Inflation expectations increase in the long run as a consequence of over-utilization, which causes the inflation rate to gradually increase from SRAS1 to SRAS2.
As the inflation rate increases, the central bank frantically tries to contain inflation by increasing the interest rate which reduces output gradually from $500 billion to $450 billion.
The bad effects come later--in the long run, the monetary expansion leads to soaring inflation without creating any new jobs. Historically, a high inflation rate is associated with lower rates of long-run economic growth. High inflation rates create uncertainty about future production costs and the future purchasing power of the currency. As a result, high inflation tends to discourage saving and investment--both important determinants of long-run economic growth.
The following graphs show the time path for the inflation rate and output between time A and time E. Notice that the good effects occur between time A and B, but the bad effects occur between times B and E.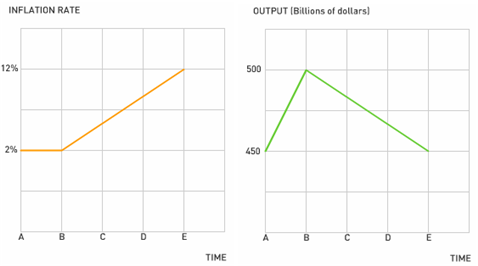 1. Despite the central bank's attempts to reduce inflation between times B and E, the inflation rate inevitably still increases. What can explain this?
2. Suppose the economy is at time E. What must Argentina's central bank do in order to reduce the inflation rate from 12% to 2%? Will this be politically popular?
3. Using the AD-AS model, explain what Friedman means by "When it comes to the cure, it's the other way around, when you stop drinking or when you stop printing money the bad effects come first and the good effects only come later. That's why it's so hard to persist with the cure."
Milton Friedman, winner of the 1976 Nobel Prize in Economics, compares inflation to alcoholism in his PBS series, Free to Choose:
Inflation is just like alcoholism, in both cases, when you start drinking or when you start printing too much money. The good effects come first; the bad effects only come later. That's why, in both cases, there is a strong temptation to overdo it, to drink too much and to print too much money. When it comes to the cure, it's the other way around, when you stop drinking or when you stop printing money the bad effects come first and the good effects only come later. That's why it's so hard to persist with the cure.Source: Free to Choose, Volume 9 of 10, How to Cure Inflation (26:40)
A simple aggregate demand (AD) and aggregate supply (AS) diagram offers great insight into Friedman's analogy and Argentina's inflation woes. The following AD-AS diagram is based on a paper by Professor David Romer. The model might be slightly different from the AD-AS diagram in your textbook.
First, let's look at the assumptions in the model. The aggregate demand curve (AD) assumes that the central bank raises the interest rate in order to combat inflation. For example, if the inflation rate increases, then the central bank will raise the interest rate to reduce consumption and investment, thereby lowering output. The short-run aggregate supply curve (SRAS) represents the inflation rate. The long-run aggregate supply curve represents the output level where the inflation rate has no tendency to change. The long-run aggregate supply curve is often referred to as potential output or full-employment output.
Second, let's look at the short-run effects of an increase in the money supply. In the short run, economists assume that the inflation rate is temporarily fixed. The short run might be a period of 1 day, 1 month, or 1 year. There is no consensus about how long the short run lasts. If the central bank expands the money supply, then the interest rate falls. A fall in the interest rate stimulates consumption and investment spending which shifts the aggregate demand curve to the right from AD1 to AD2.
 The good effects come first--in the short run, it seems as though the economy has benefited from a higher quantity of money. Output increased from $450 billion to $500 billion which creates more jobs without increasing inflation.
Third, let's look at the long-run effects of an increase in the money supply. The output level at time B is not a sustainable amount of output because $500 billion exceeds full-employment output, which is only $450 billion. An output level above the full-employment output necessarily means that resources in the economy are being over-utilized. Inflation expectations increase in the long run as a consequence of over-utilization, which causes the inflation rate to gradually increase from SRAS1 to SRAS2.
As the inflation rate increases, the central bank frantically tries to contain inflation by increasing the interest rate which reduces output gradually from $500 billion to $450 billion.
The bad effects come later--in the long run, the monetary expansion leads to soaring inflation without creating any new jobs. Historically, a high inflation rate is associated with lower rates of long-run economic growth. High inflation rates create uncertainty about future production costs and the future purchasing power of the currency. As a result, high inflation tends to discourage saving and investment--both important determinants of long-run economic growth.
The following graphs show the time path for the inflation rate and output between time A and time E. Notice that the good effects occur between time A and B, but the bad effects occur between times B and E.
1. Despite the central bank's attempts to reduce inflation between times B and E, the inflation rate inevitably still increases. What can explain this?2. Suppose the economy is at time E. What must Argentina's central bank do in order to reduce the inflation rate from 12% to 2%? Will this be politically popular?
3. Using the AD-AS model, explain what Friedman means by "When it comes to the cure, it's the other way around, when you stop drinking or when you stop printing money the bad effects come first and the good effects only come later. That's why it's so hard to persist with the cure."
Labels: Inflation, Macroeconomics, Milton Friedman, Monetary Policy, Quantity Theory of Money
12:30 PM | Permalink | Comments |
Assign Aplia Reading
![]()
![]()
 Subscribe to this blog
2 Comments:
At 3:31 PM, December 06, 2006, Anonymous
said…
Anonymous
said…
I saved an article I found recently called define inflation that I think applies here.
At 7:55 PM, November 20, 2007, realbill
said…
realbill
said…
When the Fed issues a new dollar, it gets a dollar's worth of assets in exchange, so assets rise in step with the issue of money, and there is no tendency toward inflation. Furthermore, the issue of money does not change anyone's net worth, so there is no additional spending power created by the new dollar. The Fed does not control inflation be controlling the money supply. It controls inflation by maintaining adequate backing for the money it issues.
Post a Comment
<< Home