Oil Shock, Part I: The Microeconomic View
by Chris MaklerThe chain of events that followed the announcement of the shutdown present a textbook example of economics in action. According to the New York Times:
Word of the shutdown rattled global commodities and equities markets. In the United States, oil prices rose more than two dollars a barrel. The benchmark contract for light, sweet crude to be delivered next month rose as high as $77.30 a barrel before settling at $76.98 a barrel in New York trading. Prices rose even higher in London, where Brent crude for September delivery closed at a record $78.30 a barrel…
Stocks, meanwhile, fell in American trading and slid across Europe. Major indexes in Britain, Germany and France all posted substantial declines for the day.
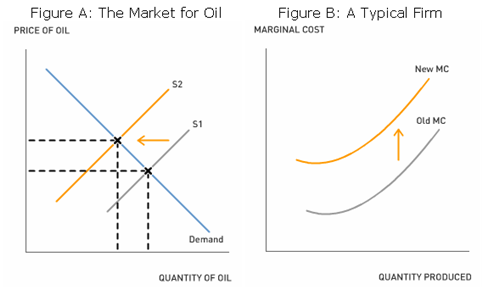
In microeconomic terms, the Prudhoe Bay closure shifts the supply curve of oil to the left, increasing the equilibrium price and decreasing the quantity of oil in the market (Figure A). Because oil is so important for the production of goods and services, an increase in its price will increase business costs worldwide (Figure B). Because higher costs reduce firms' profits, investors bid down stocks in equity markets.
 See Part II of this post for the macroeconomic impact of this supply shock.
1. Why do unexpected changes, such as this one, impact the stock market so much more than expected changes?
2. Which goods and services are most affected by changes in the price of oil? Draw a supply and demand diagram for one of those goods. How will the closing of the oil field affect the market you chose?
3. BP has been plagued by safety problems in the past few years. Like any company, it faces a tradeoff between safety and profitability. Using cost-benefit analysis, how would you find the optimal level of safety? Do you think BP chose the optimal level, or do you think it spent too little on safety? How could you find out the answer to that question?
Labels: Comparative Statics, Oil, Stock Market, Supply and Demand


0 Comments:
Post a Comment
<< Home