Wednesday, November 26, 2008

Debit or Credit?


As an economist and beloved shopper, I shudder in disbelief at how many credit-card owners still purchase items with their debit card. Assuming that you have a debit card and a credit card that is not maxed out, I present the following economic argument for why you should choose to use your credit card over your debit card.

The classic rebuttal I get to this argument is, "People are not responsible; they simply charge things without keeping track until their bill comes in." But how sound an argument is this? When you use your debit card, you still need to maintain a positive balance in your checking account so you don't overdraw and incur any fees. It only takes a little more effort to keep track of credit card purchases if you get into a routine of noting expenditures. For example, you could do the following: Upon making a purchase, set aside the purchased amount into a separate interest-bearing checking or savings account (which is easy and quick to do thanks to online banking), or track purchases in a spreadsheet or program (also easy to do with programs such as Microsoft Excel or Microsoft Money).

Another common response I hear is, "Some people keep a high balance on their credit card." When you use a debit card, the money is automatically withdrawn from your account. So the existing balance on your credit card is irrelevant when deciding whether to purchase the next item with either debit or credit since using your debit card would imply you have the cash on hand to buy it.

Even under the assumption that there is some cost to tracking expenses, there are still three significant reasons why you should use your credit card over your debit card.

1. The time cost of money
2. Typically credit cards offer better rewards programs
3. Build credit

Everyone knows that a dollar today is not worth the same as a dollar tomorrow. If you can forgo spending a dollar until a later time, then that dollar can earn interest until you actually spend it. In economics and finance, we analyze problems such as this using the concepts of present value (PV) and future value (FV). That is, the future value (FV) of a dollar today (PV) is

FV = PV x (1 + r),

where r is the interest rate over the time period in question. Since your debit card requires you to pay for the good today while the credit card allows you to pay for the good in the future at the same nominal price, economically you are better off letting the payment value collect interest until the balance is due and then paying off the balance.

Although debit cards are beginning to offer more competitive rewards programs, credit card companies typically still offer more diverse and appealing options such as cash back, miles, and points programs.

Last, the use of debit cards does not contribute to your credit rating. The responsible use of a credit card is a significant way that you as a consumer can build credit and improve your credit rating.

Discussion Questions

1. Why are some consumers unable to qualify for a credit card? Is their inability to qualify a good signal of their financial well-being?

2. How do rewards programs affect the bottom line of a credit card company? How can they afford to offer such incentives?

3. What kind of rewards would induce you to pay for something immediately rather than in the future by using your debit card over your credit card?

4. One argument for the use of debit cards is the option to receive cash back with your purchase if your bank's ATM is not near by. How does this affect your choice to use you a debit or credit card?

Labels: , , ,

Friday, November 21, 2008

Should We Be Worried About Deflation?


We're used to low and stable inflation in the United States—a slow, but steady increase in the prices of goods and services over time. The inflation rate measures the pace at which prices rise over time. The table below shows the CPI (consumer price index)—which measures the average price of a representative basket of consumer goods and services—from July to October in 2007 and 2008, as well as the annual inflation rate. In recent months, the U.S. economy experienced disinflation—the annual inflation rate, while positive, declined from a peak of 5.6% in July to 3.7% in October. The CPI continues to rise year-on-year, but it's doing so at a slower and slower pace.

Notice that the CPI declined significantly in October 2008 (from 218.8 in Sep '08 to 216.6 in Oct '08). In fact, the 1% decrease in consumer prices during October 2008 was the largest one month decline in 61 years. The sharp month-on-month decline in prices raised some fear of deflation. Deflation occurs when the prices of goods and services fall over time. Persistent deflation leads to negative annual inflation rates.


A sharp reduction in total spending by businesses and consumers typically precedes an overall drop in prices. For deflation to persist, business and consumer expectations must adjust. If people expect prices to continue falling, they will postpone purchases. Why buy today what can be obtained more cheaply tomorrow? The postponed spending reduces the current demand for goods and services. With weaker demand, prices fall even further and firms begin to cut back on production and lay off workers. Should we be concerned about this type of deflationary spiral?

Exploring the difference between headline and core inflation can help us answer this question. Headline inflation, reported in the table above, measures changes in all consumer prices. Core inflation measures changes in the CPI excluding food and energy prices. Since food and energy prices tend to be volatile compared to other prices, removing them from the CPI can allow economists to obtain a less distorted view of the inflation trend. The core inflation picture for October 2008 is far less alarming—the CPI less food and energy prices barely registered a change.

Falling energy prices were the primary cause of headline deflation in the month of October. A decrease in the relative price of energy is not necessarily a bad thing. A good's relative price is measured in physical units. Suppose that, in May 2008, the price of gas was $4 per gallon and the price of a movie ticket was $8. To express the relative price of gas in May 2008, we'd say that one gallon of gas cost one-half of a movie ticket. If, in October 2008, gas is down to $2 per gallon but movie tickets still cost $8, we'd say that the relative price of gas is one-quarter of a movie ticket. In other words, gas has become relatively cheaper since energy prices are falling as other prices remain largely the same.

Nobody's complaining about relatively inexpensive gas. Declining energy prices will likely feed through to the prices of other goods and services in the coming months. We may even see a negative year-on-year inflation rate. But a damaging deflationary spiral still seems like a remote possibility. Only when consumers and businesses begin to build expectations of falling prices into their decisions will deflation become a real threat.

Discussion Questions

1. Deflation presents big problems for debtors. Recall that the real interest rate a borrow pays on a loan is equal to the nominal interest rate minus the inflation rate. If you take out a fixed rate loan with a nominal rate of 8% and expected inflation of 2%, you'd expect to pay a real rate of 6%. What happens to your real rate if falling prices push the actual inflation rate to -1%?

2. What would deflation do to the purchasing power of a debtor's principal balance? For instance, how would persistent deflation affect people's ability to repay home loans? How would it affect the already beleaguered housing market?

3. If the Fed fears persistent deflation, what policies should it pursue to ensure that deflationary expectations do not develop? What are the risks associated with anti-deflationary monetary policy? How could government fiscal policy assist the Fed in preventing deflation?

Labels: , , , ,

Friday, November 14, 2008

America's Looming Liquidity Trap


In October 2008, the US unemployment rate hit 6.5%, a 14-and-a-half year high, as announced by the Labor Department. This lofty rate is likely to increase in the coming months in the wake of the ongoing financial crisis and adjustments in the real estate market. It also comes despite two 50 basis point cuts in the target federal funds rate made by the Federal Reserve during that month. These interest rate reductions brought the target fed funds rate down to 1%, a very low target rate by historical standards and close to the nominal rate floor of 0%. The Federal Reserve therefore finds itself in the thorny situation of having only 100 basis points left to work with for possible target rate cuts. (Note that a basis point represents 1/100th of a percentage point, so 1% is 100 basis points.)

The fed funds rate cannot go below 0% because a transaction at a negative nominal rate implies a negative nominal cost of borrowing funds. Furthermore, that implies a positive nominal payoff to the borrower and a positive nominal loss to the lender. Under typical, positive rates of inflation, the real costs and payoffs are amplified. This is shown in the following Fisher equation where i is the nominal interest rate, r is the real interest rate, and is the inflation rate:
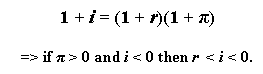

This floor for the nominal fed funds rate brings up the very real possibility that the US will soon be mired in a liquidity trap—a situation in which "the monetary authority is unable to stimulate the economy with traditional monetary policy tools." One explanation for this weakness of monetary policy comes from the analysis on the real interest rate given above. In difficult economic times, why would financial institutions take on the risk of lending out money to a borrower who may default on the loan when the real return on even a fully repaid loan is negative!

An excellent source on how our nation might remedy its liquidity trap is given by the 2008 Nobel Laureate in Economic Sciences, Paul Krugman. His 1999 article "Thinking About the Liquidity Trap" offered policy solutions for springing the Japanese economy from the type of liquidity trap that now threatens the United States. Krugman's figure 1 from that paper shows a nice IS-LM example of the ineffectiveness of monetary policy. Wikipedia provides a good introduction to the IS-LM model. Below I present a modified version of Krugman's figure 1, in the context of current US interest rates, to represent traditional monetary expansion with a looming liquidity trap.


An economy may also happen to face declining consumption expenditures, as the US currently does, due to concerns about a rising unemployment rate, which can result in lower exogenous consumption and a falling marginal propensity to consume. In that case, the resulting leftward movements of the IS curve make monetary policy even less effective. Krugman's solution to the scenario is to have the monetary authorities credibly commit to sustained higher future inflation. The expectation that such higher inflation will eat away at the purchasing power of cash holdings should convince consumers to ramp up their spending and move the IS curve rightward.

President-elect Obama and the new Congress will undoubtedly undertake expansionary fiscal policy to attempt to move the IS curve rightward. However, our already massive national debt and the likelihood of waste involved in government spending, support Krugman's solution. Our newly elected officials and the Federal Reserve Board are facing unenviable policy choices.

Discussion Questions

1. Suppose that you were in control of US fiscal and monetary policy. What policies, if any, would you implement to improve US economic conditions?

2. Do you believe that America will soon face a liquidity trap? Why or why not?

3. The International Monetary Fund forecasts that the world's rich economies will collectively experience economic contraction for the first time since World War II. When was the last time America faced a liquidity trap? What circumstances led to that liquidity trap environment?

Labels: , , , , , , , ,

Friday, November 07, 2008

Precious News


News of Barack Obama's historic election on November 4 dramatically increased demand for newspapers on November 5. Tall, bold headlines announcing the nation's new president transformed copies of the daily paper into collector's items. Though many publishers printed thousands of extra copies in anticipation of higher demand for their post-election issue, at newsstand prices, supply simply couldn't keep up with the surge in demand. On Wednesday morning, many looking to own a piece of history found only empty news boxes and long lines in front of newsstands.

Not surprisingly, copies of major newspapers' November 5, 2008 issue began selling for as much as $200 on eBay and Craigslist.

This is a classic example of how a market responds to an increase in demand. The market equilibrium on a normal day for newspapers is at point A with price P1 and quantity Q1. As the demand curve for newspapers shifts rightward from D1 to D2 (people want more newspapers at any given price level), both equilibrium quantity and equilibrium price of newspapers increase as a result—from P1 to P2, and Q1 to Q2. On November 5, the quantity of newspapers supplied increased in part because publishers anticipated higher demand and in part because they scrambled to reprint when demand was even higher than expected. In the end, more newspapers appeared in the market, and at higher prices. The new market equilibrium for newspapers on November 5 is now at point B.


Though the consequences of the sudden shock in demand for November 5 newspapers are pretty much as expected, the reasons behind this shock are not so clear.

Though newspapers received renewed attention after the election, newspaper circulation has fallen steadily across the country for years. The ease of instant access to up-to-date information and the accessibility of free content have turned many readers to the Internet for news. The spike in demand for newspapers after the election raises interesting questions about the value of the daily newspaper in a digital world.

Discussion Questions

1. With the prominence of the Internet, why do you think people still wanted physical copies of newspapers with news they probably already knew? What factors do you think drove up the value of newspapers after the election? What do paper newspapers have that websites do not?

2. Some newspapers also raised the price of their November 5 issue. The Washington Post, for example, increased the price of their special post-election edition from $0.50 to $1.50. Considering the huge mark-ups for copies of November 5's newspaper on the Internet, why didn't newspapers raise their own prices even more, to, say, $20 per copy?

3. Does scarcity exist on the Internet? If so, how does it compare to scarcity offline? If not, how does that affect the value of virtual goods as compared to physical goods?

Labels: ,