Monday, June 26, 2006

Net Neutrality


The Internet presents a challenge for economic thinkers. Because it's new and changing rapidly, economists struggle to draw substantive conclusions based on data. As a result, they are largely left to argue over which of the economic models designed to describe the "old economy" are most appropriate for examining the "new economy."

The economic question stirring the most debate right now has to do with network neutrality, or "net neutrality." (Someone asked a ninja recently about it. Someone also asked Greg Mankiw. The ninja had an answer, and Mankiw didn't.) In a neutral network, internet service providers (ISPs) give equal weight to all websites. Suppose AT&T provides your internet service. AT&T recently merged with SBC, which has a partnership with Yahoo. Under the current neutral network, you can conduct searches with Yahoo or Google, and neither Yahoo nor Google have to pay AT&T for delivering their content to you.

Suppose, though, that AT&T could charge websites for the speed of content delivery. If Google doesn't agree to pay for faster delivery of its search results, videos, and other content, AT&T might make the Yahoo site--a business partner--load up a lot faster than Google. Does it have the right to do so? A bill working its way through Congress would give it that right; this has led to a revolt among Internet users and Internet companies like Google.

The opposing sides of the debate use different economic models to support their respective positions. According to supporters of the legislation, sites offering content that uses lots of bandwidth, like youtube.com, currently use ISP-maintained infrastructure for free, and such sites should have to pay for that bandwidth. Because bandwidth is scarce (or becoming scarce as the Internet becomes more congested), the argument goes, allowing ISPs to charge for it will ensure that bandwidth goes to those who can use it most profitably. For example, Robert Litan of the Brookings Institution, argues that using the Internet to deliver health care to disabled people would amount to nearly $1 trillion of cost savings--but only if doctors can be sure that the data they get is uncorrupted by, say, a video broadcast of "Ask a Ninja." Without a market for broadband, those kinds of cost savings will not be realizable. Similarly, Robert Hahn and Scott Wallsten argue that "mandating net neutrality, like most other forms of price regulation, is poor policy." All of these economists treat broadband access as a private good, subject to the usual laws of supply and demand.

Opponents of the legislation are organized on http://www.savetheinternet.com/. They claim the more appropriate model is that of monopoly or oligopoly: ISPs are so large that they would have market power and charge excessively high prices for broadband in order to maximize their profits. Consequently, the number of websites would dwindle, and the Internet would be a much less varied place. More insidiously, this would have a cascading effect on other Internet innovations: the fact that access to Internet users has been relatively cheap up until this point has allowed a myriad of new Internet startups to take risks by creating or entering new markets.

1. Which economic models that you have studied are most applicable to the market for broadband? Why?

2. Hahn and Wallsten argue that as long as the market for ISPs is competitive, the market for broadband will be as well. They suggest that the better way of fostering competition is to ensure that the market for ISPs is indeed competitive. Is this reasonable?

3. Both sides of the debate argue that their position is better for innovation. What kind of innovations might not occur if net neutrality is maintained? What kinds of innovations might not occur if a market for broadband were to exist? Is there any way of weighing the pros and cons of those kinds of innovations?

Labels: , , ,

Wednesday, June 21, 2006

Baby Bonus Blunder?


Australians live longer and have fewer children than they used to. In fact, most of the 30 countries in the Organization for Economic Co-operation and Development (OECD) show the classic signs of ageing: rising life expectancy and falling fertility rates. Life expectancy at birth measures the number of years an average person in a population can expect to live. The fertility rate for a population is the average number of childbirths per woman of child-bearing age. Longer life expectancy and lower fertility rates mean that retirees make up a larger share of OECD populations. The graphs below shows the OECD's estimates and projections for life expectancy and the fertility rate.


In OECD countries, retirees receive public benefits, like Social Security or Medicare in the United States, that are financed with taxes from active workers. As a population ages, the ratio of retirees to workers rises--the pool of beneficiaries expands as the tax base shrinks. The pressure on public finances in OECD countries will continue to rise unless the countries adopt policies that raise tax revenues or cut benefits. A host of possible solutions exists, not all of them politically palatable: increasing taxes on workers, cutting retiree benefits, increasing the retirement age, or opening borders to more immigrant workers.

In 2004, the Australian government tackled declining fertility rates head on with a cash-for-babies policy. In May of 2004, the government announced Australian parents would receive A$3,000 (US$2,200) for newborns delivered on or after July 1, 2004. Time will tell whether Australia's baby bonus is large enough to noticeably increase fertility rates, but economists Joshua Gans and Andrew Leigh found that the baby bonus announcement had a big impact in the short term (download their research paper here). How do you think Australian parents with late June due dates responded to the government's announcement? Read Gans and Leigh's opinion piece in The Australian to find out.

1. On which day during the past 30 years were the most Australian babies born? Why?

2. According to Gans and Leigh, roughly 1,000 births were moved as a result of the 2004 baby bonus announcement. Of those, how many births were moved by more than three weeks? How is it possible to postpone births? How did the baby bonus announcement affect Australian maternity wards?

3. Despite the evidence of delayed births resulting from the 2004 announcement, the Australian government recently announced that the baby bonus will rise to A$4,000 on July 1, 2006. How, according to Gans and Leigh, should maternity wards and expectant mothers cope with the transition to the higher bonus? What can the government do to avoid similar disruptions in the future?

4. The rapidly expanding career opportunities for women in OECD countries present would-be moms with tougher trade-offs. Take a career detour to raise-up kids or continue pursuing the corner office? We know that the baby bonus announcement has a big reshuffling effect on birth dates in the short term, but its long-term effects on the kids-career tradeoff and fertility rates are less certain. Do you think Australia's baby bonus will offset a significant portion of the opportunity costs of childbirth faced by working women?

5. Can you think of other policies that would reduce the ratio of benefit-receiving retirees to tax-paying workers? Should the retirement age rise with life expectancy? How would more open immigration policies affect the ratio of retirees to workers? How would more immigration affect racial inequality if immigrants are of a different race than native-born workers?

Topics: Incentives, Trade-offs, Ageing populations

Labels: ,

Friday, June 16, 2006

An iTunes Index for Exchange Rates


This week, The Economist celebrated the 20th anniversary of its Big Mac Index. The newspaper regularly examines how current exchange rates compare to purchasing power parity (or PPP). The price of a standardized commodity that is otherwise locally produced, like Big Macs or Starbucks Lattes, is compared across countries. According to PPP, exchange rates should adjust so that a consumer's purchasing power is the same across countries. Big Mac prices can, therefore, give an indication as to where PPP exchange rates should be.

Of course, Big Mac prices build in the differences in local production costs between countries. For example, the price of beef is lower in Australia than in Japan, and Australian Big Mac prices reflect the lower input cost. Perhaps a standardized commodity that is free of variations in local costs would provide more accurate PPP exchange rate estimates.

Consider individual song downloads on iTunes. Like Big Macs, their pricing is set by a single firm--in this case, Apple. Unlike Big Macs, we can expect that there are no local variations in costs. Apple negotiates with the same music company (Sony, BMG, etc.) for the rights to digital provision of a given song. Hence, any cross-country differences in download prices likely arise from differences in demand.

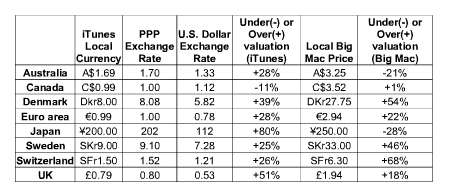
There are many iTunes stores but only nine distinct local currency prices for iTunes downloads. The price of an iTunes download in the United States is US$0.99. The following table shows the price of downloading a song on iTunes in eight additional currencies. The second row shows the PPP exchange rate. This is simply the local price of an iTunes download divided by the American price (US$0.99). For example, iTunes prices suggest a PPP exchange rate of A$1.70 per US$1.00 between Australia and the United States (A$1.69 / US$0.99).

The third column shows the actual dollar exchange rate as of May 22. For example, the actual exchange rate between Australia and the United States was A$1.33 per U.S. dollar. The PPP exchange rate implied by iTunes prices suggests that the Australian dollar is overvalued--that is, it should take more than A$1.33 to purchase an American dollar (since it takes A$1.69 to buy an iTunes download worth only US$0.99 in the United States). The fourth column indicates whether a currency is over (+) or under (-) valued against the dollar according to the PPP exchange rate.

The final two columns show the local currency prices of Big Macs and the under or over valuation of each currency against the dollar when Big Mac prices are used to compute PPP exchange rates. The price of an American Big Mac on May 22 was $3.10.


There are two things interesting to note here. First, apart from Canada, iTunes songs are priced at a premium over the United States in all other music stores. Second, there doesn't appear to be a positive relationship between the PPP exchange rates implied by the iTunes and Big Mac indexes.

In theory, if Apple based its iTunes pricing optimally on long-term forecasts of exchange rates, then the iTunes Index should out-predict the Big Mac Index for exchange rate movements, as it is free of local variation. Only time will tell on that.

1. Apple appears to be practicing international price discrimination in its iTunes pricing. Usually, the richer the country, the higher the price. However, the United States has the highest GDP per capita but the second lowest prices. Can you think of any cost differences that might account for this? Can you think of reasons why the elasticity of demand for paid downloaded music is lower in Japan and Australia than in the United States? Do you think Apple is pricing optimally?

2. Big Mac pricing is probably more flexible than iTunes pricing. Apple may find it hard to change iTunes pricing once it announces a price point. What does this suggest about the relative merits of each as a predictor of PPP exchange rates? Does this suggest that iTunes may face some painful pricing realignment in the future?

3. Can you think of other commodities that might provide appropriate standards for predicting PPP exchange rates?

4. How do the other exchange rates compare using the Big Mac and iTunes instance? For example, calculate the Australia-Japan exchange rate and see how the relative prices for iTunes and Big Macs differ from these.

Joshua Gans is Professor of Management (Information Economics). The iTunes Index was first suggested by him earlier this year on his blog, economics.com.au.

Labels: , ,

Saving America


The U.S. trade deficit increased 2.4% between March and April 2006, which should be no surprise to our blog readers (archived entry: trade deficit and the negative saving rate). Some people point to China's fixed exchange rate or to the high oil prices for America's trade woes, but many macroeconomists contend that it is the lack of national saving that drives the trade deficit in the long run.

There are two markets that we have to consider when we examine the impact of saving on the trade deficit. First, consider the market for loanable funds, which determines the long-run real interest rate. Second, consider the relationship between the real interest rate and net exports. For simplicity, we're going to deal with absolute amounts (dollars) rather than relative amounts (percentages).

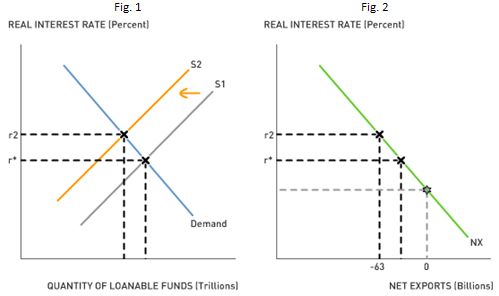
The market for loanable funds is where savers and lenders interact. Like any market, there's a supply and a demand. The demand for loanable funds consists of U.S. firms that want to borrow. The supply of loanable funds consists of U.S. firms, households, foreigners, and governments that want to lend. The price of loanable funds is the real interest rate, which is considered the "cost of borrowing" to borrowers and the "rate of return" to savers. The equilibrium real interest rate is where supply intersects demand, r*.

So what happens when the federal government increases its budget deficit and households decide to spend a larger share of their disposable income? An increase in the government budget deficit reduces public saving, and the increase in consumption reduces private saving. Put those two effects together, and we have a net decline in the supply of saving, which causes the equilibrium real interest rate to rise from r* to r2. (See Fig. 1.)A decrease in total saving in the United States pushes up the real interest rate. The real interest rate represents the rate of return for holding U.S. assets. If the real interest rate rises, then foreigners will want to buy more U.S. assets than they did before the rise. In order for foreigners to purchase U.S. assets, they must purchase U.S. dollars. Consequently, the demand for dollars increases, which increases the price of U.S. dollars. An appreciation of the U.S. currency, in real terms, will make U.S. exports less competitive and imports from foreign countries more attractive. An increase in the real interest rate causes a decrease in net exports and worsens the U.S. trade deficit. (See Fig. 2.)

Discussion Questions

1. According to our analysis, a fall in total saving actually increased the U.S. consumer's purchasing power of foreign goods and services (more U.S. imports) while it decreased the foreign consumer's purchasing power of U.S. goods and services (fewer U.S. exports). Is this an economic disaster or a sign that Americans are relatively wealthier than most people in the world?

2. A decrease in total saving increases the real interest rate, and a higher real interest rate increases foreign demand for U.S. assets, causing the price of the dollar--the real exchange rate--to rise. China purchases many U.S. assets in order to keep the value of its currency, the renminbi, relatively cheap compared to the dollar. In doing so, China intends to sustain American demand for Chinese-made goods. How does China's fixed nominal exchange rate policy affect the U.S. trade deficit in the long run?

3. If permanently higher oil prices reduce U.S. potential output, how does this affect national saving in the long run? How does this affect the trade deficit in the long run?

Labels: , , ,

Wednesday, June 14, 2006

Labor Negotiations: The Non-Medical Incentives of Childbirth


6-6-06 passed recently with nary an episode of satanic import. Nonetheless, some mothers-to-be, late in the third trimester, did not like the idea of delivering on the Day of the Beast--lest their newborn be mistaken for the spawn of Satan. According to a new research paper by Joshua Gans and Andrew Leigh, physicians were probably open to helping parents avoid the inauspicious date. It's not that physicians feared the delivery of the anti-Christ. Rather, June 6, 2006 fell on a Tuesday--so inducing labor in an expectant mother a day earlier or later wouldn't cut into the doctor's weekend tee-time.

Parents often hope to induce or postpone labor for all sorts of non-medical reasons, ranging from tax purposes (parents in many countries stand to capture a sizable tax credit should their babies pop out before January 1) to cultural reasons (choosing the year of the dog over the year of the pig, or Sagittarius over Capricorn). One particularly inauspicious day to be born on is February 29, since that date occurs only once every four years.

On the other hand, physicians have their own preferences over birth dates. In particular, there is a well-documented "weekend effect" in the timing of births. It's safe to assume that neither babies nor women's bodies know the day of the week; yet according to Gans and Leigh, "nearly 29% fewer births occurred on weekends than an even distribution [over days of the week] would predict." Several recent papers have suggested that the reason for this is that it is more expensive to perform medical procedures on weekends, and also that physicians would prefer not to work on weekends.

Think of what happens, then, when an inauspicious day--like, for example, February 29--occurs on a Monday. In such cases, doctors and patients face potentially conflicting incentives. Expectant parents want to induce labor to avoid leap-year babies and physicians want to avoid working on the weekend. Who wins out?

Read the abstract, introduction, and conclusion of the research paper to find out how the conflict of incentives typically sorts itself out. Follow this link and scroll toward the bottom of the page (under the "SSRN Electronic Paper Collection" heading) to download a pdf of the paper.

1. According to Gans and Leigh, how often do physicians accommodate expectant parents who want to induce weekend labor for non-medical reasons?

2. What do the paper's results suggest about the balance of bargaining power between patients and doctors (or other labor resources at hospitals, such as nurses)? Is the medical services consumer always sovereign?

3. Do expectant parents incur more expenses if they give birth on a weekend, or less? What about doctors and hospitals? How might a pricing scheme that allows hospitals to charge different prices for weekend and weekday births improve the welfare of doctors and patients?

4. Think about the statistical methods Gans and Leigh use to make their point. One might think that for tax reasons, January 1 would be a good date to examine for this effect. Why is February 29 a better date study than January 1 for the purposes of this? (Hint: If you were trying to examine the point Gans and Leigh are looking at, you would need to make sure that only the patients cared about the "inauspicious" day, and that only the doctors cared about the weekend…)

Thanks to Chris Makler for valuable additions to this post.

Labels: ,

Wednesday, June 07, 2006

Family Values


School's out for summer. For lots of college students that means moving back in with the parents. It may seem uncomfortable, having led the hedonistic college life, to move back into the room with your old little league trophies. But something even weirder may await you in a few years.

Your parents may move in with you.

According to an article in the New York Times, "multigenerational households"--those with three or more generations under one roof--are the fastest-growing type of housing arrangement in the United States, especially in places like California where skyrocketing housing costs force families to pool their resources. Also driving multigenerational household growth are working single mothers, whose own mothers often move in to care for the children during the workday.

Housing markets are responding to the demand for multigenerational households. Architects are designing larger houses with separate entrances, big kitchens for "social networking," and lower light switches "so they can be reached both by those in wheelchairs and by children."

In many ways, this trend corrects the inefficiency of living arrangements in the latter part of the twentieth century. Consider a family with three generations: a husband and wife who each have jobs, their two children, ages 1 and 3, and the wife's parents. Suppose the family has two options:

1) The grandparents live in a 900-square-foot apartment that costs $1,200 per month; the married couple and their kids live in an 1,800 square foot house that costs $2,000 per month; the children are in day care at a total cost of $800 per month.

2) They all live together in a 4,000-square-foot house that costs $3,000 per month; the grandparents look after the children, so they don't need to go to day care.

Which is more efficient? The total cost of the first option is $4,000 per month, and the total living space is 2,700 square feet. The total cost of the second option is $3,000 per month, and the total living space is 4,000 square feet. At first glance, therefore, it may seem that the second option, with more space at less cost, is more efficient.

Does that mean that the grandparents should move in with their daughter? Not necessarily. It's not unreasonable to assume that people derive utility from being the head of their own household; sharing a living space isn't easy under the best of circumstances. Couples and their parents often have differing views on the best way to raise children/grandchildren, and these tensions will probably intensify if they live under the same roof. By the same token, people may prefer to have their own parents watch their children, rather than hire a nanny or send the kids to all-day preschool. The saved money can be used for other things--like a vacation away from home. In short, it's only efficient for the grandparents to move in if the net psychic costs and other inconveniences are worth the benefits of the extra living space and saved cash.

1. Suppose that, as housing prices rise, more people form multigenerational households. What implication does this have on the demand for apartments? For large homes? If you were to speculate in the real estate market, how would this article affect your optimal long-term portfolio?

2. Some of this phenomenon is driven by the fact that the baby boomers are retiring. What is likely to happen to the housing market in twenty years, as the boomers pass away? How might this affect their children's willingness to share a large house with them now?

Topics: Housing markets, Efficiency

Labels:

Monday, June 05, 2006

Why Does Bernanke's Small Talk Move Markets?


Consider the Bartiromo Affair: At a media dinner party, Federal Reserve Chairman, Ben Bernanke tells CNBC reporter Maria Bartiromo that Wall Street types underestimate his inflation-fighting credentials and expresses his willingness to continue raising the Fed's interest rate target in order to check inflation. Ms. Bartiromo finds the comments newsworthy, reports the chairman's sentiments on her CNBC program, and sets off a sharp decline in stock prices just before the market closed on Monday, May 1. Keep in mind that stock prices move up and down all of the time for lots of different--often inexplicable--reasons. Ms. Bartiromo's TV show may or may not explain the movements at the end of the day on May 1. Generally, however, changes in interest rates (or expected changes) send stock prices in the opposite direction--that is, interest rates and stock prices are negatively related. Why?

The Fed influences a variety of interest rates in the economy by targeting changes in the federal funds rate. Interest rates have a direct effect on stock values, because investors have required returns they demand for holding financial assets, like stocks. Suppose an investor thinks she can earn a 5% return on her money by purchasing financial assets. Holding risk aside, she will only buy a stock if she expects it to provide a 5% return, but if the Fed raises interest rates, investors will require higher returns for holding stocks.

We can perform a crude stock valuation by assuming a stock will pay a constant dividend forever (a perpetuity) and investors’ returns are derived solely from dividends. Under this assumption, the price, or present value, of a stock simplifies to:

Present Value of Stock = Dividends per Share / Interest Rate

Suppose IBM's stock earns $1 per share. At an interest rate of 5%, the present value of IBM's stock is $1 / 0.05 = $20. If tightened monetary policy raises the interest rate to 6%, our crude valuation model predicts the stock’s value falls to $1 / 0.06 = $16.67. If dividends per share remain constant, an increase in the interest rate reduces stock values.

1. According to this valuation model, what happens to stock prices (present value) when the Fed targets lower interest rates?

2. Peoples' expectations about interest rates or dividends per share change stock values as well. Excessively tight monetary policy (higher interest rates) can lead to an economic recession. What happens to corporate profits during recession? If people expect that tight monetary policy will lead to recession, what will happen to stock values?

3. How did Ms Bartiromo's report about the Fed chair's dinner party comments affect peoples' interest rate expectations? How will a change in interest rate expectations affect required returns and stock valuations?

4. The Federal Reserve is one of the only central banks without an explicit inflation target. As a result, there is still considerable guesswork involved in determining the Fed's tolerance for inflation--that's one reason the Fed chairman's offhand comments receive so much attention. Uncertainty about the inflation target makes it more difficult to anticipate monetary policy. In the absence of clear monetary policy goals, small bits of information that change expectations can disrupt financial markets.

Ben Bernanke is an advocate of explicit inflation targeting--publicly announcing an inflation target and committing the central bank to its achievement. Would an explicit inflation target take some of the mystery out of monetary policy? How would explicit inflation targets change the likelihood of another Bartiromo Affair? How might an explicit inflation target inhibit the Fed's use of monetary policy during an economic crisis?

Nell Henderson offers a more detailed account of the Bartiromo Affair in the Washington Post.

Vikas Bajaj discusses the links between Fed policies and changes in both American and foreign financial markets in a New York Times article.

The idea for the post comes from Paul Romer's Econ 510 community discussion forum. Thanks also to Chris Buzzard for shoring up the finance.

Labels: , ,

Friday, June 02, 2006

The Economics of Genocide


A recent op-ed by Alan J. Kuperman in the New York Times entitled "Strategic Victimhood in Sudan" advances a controversial theory: that rebel leaders in the Darfur region of Sudan share responsibility for the continued atrocities befalling their own people. Kuperman argues that the Save Darfur movement, made primarily of concerned Westerners, should stop interfering if it wants the genocide to end.

Before we get to his argument, a bit of history. Loosely speaking, there are two sides in the decades-old civil war: one which supports the rebels and one which supports the government. Over the last few years, the Sudanese government has armed local militias called the janjaweed. The government-sponsored janjaweed militias terrorize the villages that support the rebels, raping and murdering civilian inhabitants. These atrocities have provoked outrage around the world.

Recently, international mediators proposed a peace deal. The Sudanese government agreed to it, but the rebels rejected the deal because it didn't give them full autonomy over their own lands. The mediators went back to the Sudanese government and extracted further concessions. One of the rebel groups agreed to the new terms, but now the various rebel factions are fighting among themselves.

According to Kuperman, "the rebels were willing to let genocide continue against their own people rather than compromise their demand for power." He argues that:

The rebels, much weaker than the government, would logically have sued for peace long ago. Because of the Save Darfur movement, however, the rebels believe that the longer they provoke genocidal retaliation, the more the West will pressure Sudan to hand them control of the region. Sadly, this message was reinforced when the rebels' initial rejection of peace last month was rewarded by American officials' extracting further concessions from Khartoum.

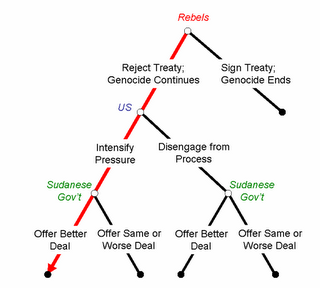
His argument amounts to an economic model: the rebels have an incentive to "provoke genocidal retaliation," and this incentive is reinforced by the well-meaning people in the Save Darfur movement. This model may be seen by the game tree in the following diagram:

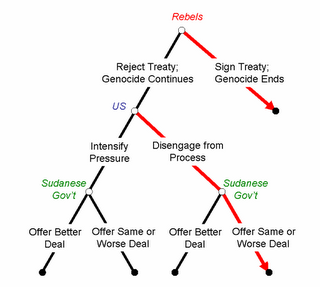
Consequently, Kuperman argues, the optimal strategy for the United States to adopt is to disengage from the process. If we were to do this, the rebels wouldn't stand to gain by continuing to fight, because the Sudanese government wouldn't have an incentive to offer a better deal; therefore the rebels would have an incentive to sign the treaty, thereby ending the genocide:

But does Kuperman's argument make sense? Is the Save Darfur movement really unwittingly responsible for perpetuating the genocide? Some basic economic analysis can help us parse Kuperman's arguments and shed some light on what can best be done to help stop the violence in the region.

There are two ways to argue against the applicability of an economic model: you can say that its internal logic is inconsistent (i.e., its assumptions don't lead to its conclusions) or you can argue that its assumptions are not valid.

1.Try to think of the negotiations between the rebels and the government, both violent and nonviolent, as an economic game. According to Kuperman, what actions are available to the rebels and the government, and what are the payoffs for each set of actions? Do you think the game Kuperman proposes is an accurate reflection of the situation in Sudan? Or is his model misspecified in some way? If you think his setup is incorrect, how would you set the game up differently?

2. Suppose we grant Kuperman's assumption that the genocide bolsters Western support for the rebels and helps them extract further concessions from the Sudanese government. Why would the Sudanese government continue to commit atrocities in this case? If they wouldn't, does this mean that Kuperman's logic is internally inconsistent? If they would, then how can you explain this seeming contradiction?

3. Kuperman argues that "we should let Sudan's army handle any recalcitrant rebels, on condition that it eschew war crimes…[i]ndeed, to avoid further catastrophes like Darfur, the United States should announce a policy of never intervening to help provocative rebels, diplomatically or militarily, so long as opposing armies avoid excessive retaliation." Is this the only possible course of action consistent with his model? What other policy options are there?

4. Think about the last question from the opposite side now. First, what, in your estimation, is the best policy to pursue in Sudan? Now try to write down an economic model of the conflict in Darfur that would yield your policy recommendation as the best possible policy. What are the features of that model? In what way are they similar to Kuperman's, and in what way are they different?

Topics: Game Theory, International Relations