
Financial Market Risks and Negative Nominal T-bill Rates
by Michael Enriquez On September 17, in the immediate aftermath of the Lehman Brothers bankruptcy, the AIG bailout, and the mortgage crisis, negative nominal Treasury bill rates briefly appeared for the first time since January 1940. As Madlen Read points out, a negative nominal Treasury bill rate implies that “investors were willing to take a small loss on the security.”
At first glance, such behavior on the part of seasoned investors seems odd. Why pay more for a security than the amount the US Federal government guarantees to pay you in the future1? One possibility would be that the general price level could fall so that the smaller future payment would represent more purchasing power than the current price of the security. That is, if the price level falls enough, the $1000 payment one receives in several months could buy more than, say the $1000.05 price of the bill could buy today. There is some evidence for this: the US Bureau of Labor Statistics reports that in 2008, on a monthly basis, the percentage change in the CPI was 1.1% in June, 0.8% in July, and –0.1% in August. However, if that is the case, one would still get more purchasing power by holding the $1000.05 in cash through the period of falling prices than by receiving only $1000 in the future. Yet, where can such cash be stored safely?
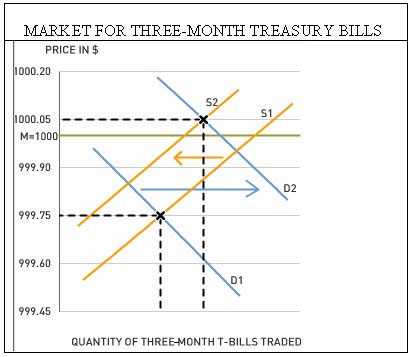
A more likely explanation is that growing fears of systemic risk have discouraged investors from holding any but the safest financial assets. One example of systemic risk comes from the Reserve Primary Fund, the oldest U.S. money-market fund, which lost two-thirds of its asset value due to its investment in Lehman Brothers’s debt. Wary investors fear that similar losses could threaten other financial institutions. Since US Treasuries are generally considered to be the safest investment possible, there was apparently a rush to invest in these securities. Therefore, an increase in demand for T-bills was likely accompanied by a reduced willingness to sell such securities. The latter represents a decline in the supply of T-bills. Both sides of the market then acted in unison to push up the price of T-bills to such an extent that their sales prices briefly exceeded their maturity values. The maturity value, represented on the graph below by the M=1000 line, is the amount, typically $1000, that the bill specifies will be paid to the owner at maturity.
We can solve for the negative nominal rate mathematically using the following formula:

where M is the bill’s maturity value, PB is the bill’s price, and r is its annualized rate of return on the bill when it is held to maturity.
To illustrate the negative rate phenomenon, suppose that for a $1000 maturity value, the market trades a 3-month T-bill at a price of $1000.05. The nominal rate of return, r, is therefore –.02%.
Negative nominal rates were described here in the context of the Japanese market by Daniel L. Thornton in the January 1999 issue of "Monetary Trends." In the article, Thornton states that “investors are willing to accept a negative nominal return on a risk-free asset because holding it is cheaper and less risky than transporting and storing cash.” So it seems that for one day at least, investors were willing to lock in a nominal loss on a safe asset rather than risk leaving cash in financial institutions.
Discussion Questions
1. The Lehman Brothers bankruptcy, the AIG bailout, and the mortgage crisis have apparently shaken investor confidence in financial institutions. Do you think their fears are justified? Do you believe that these financial events have had an impact on your life? If yes, how, and if not, then why not?
2. How might forecasts of a falling general price level in the near future help to explain investors' willingness to accept negative nominal T-bill rates?
3. The dramatic shifting of funds into the safety of Treasuries implies that funds left other sectors. With many financial sites available, you can find information the returns on various financial assets online. Which investment sectors had the largest declines on Sept. 17, 2008? Which investment sectors had the largest gains on that day? How would you explain the results that you found?
-------------------------------------
1 Recall that T-bills have zero coupons which means that they make no payment until the maturity date.
Labels: Banking, Finance, Global Economic Watch, Inflation, Interest Rate, Money
7:05 PM | Permalink | Comments |
Assign Aplia Reading
![]()
![]()

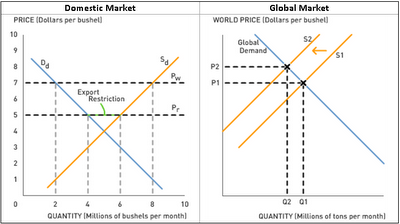 The export restrictions may have kept food prices down in domestic markets of major grain exporters, but from a global perspective, the restrictions undoubtedly prolonged the food crisis. As major grain exporters restricted the amount of grain leaving their borders, the global supply of grains declined, leading to higher grain prices and reduced availability in the rest of the world.
 Subscribe to this blog