Friday, April 03, 2009

On Income Caps and the Market System


Yesterday morning on a local radio station, a few callers discussed a silly idea. The question posed to listeners was this: "Should there be a law against anyone earning over $1 million per year?" One caller talked about the celebrity Kim Kardashian, and how it is not right that she earns so much money. That is absurd. The market is rewarding Kim because of her looks, her connections, and because in recent years her public persona has been well-managed. If companies want to pay her ridiculous amounts of money for her various "talents" because people enjoy being entertained by her, then so be it. It might not be fair, but neither is life. On the bright side, we have a progressive income tax system that will tax such extravagant incomes at higher rates than the rates faced by ordinary Americans. A much better idea would be to raise marginal income tax rates on the highest tax brackets to help limit our budget deficits and get a fair amount of tax revenue from those whom our market system has allowed to earn enormous amounts of income in our nation.

Yet, how could economists ridicule a ban on excessive income when they support President Obama's limits on executive pay for firms that seek government assistance? The reason is that such firms were mismanaged, and as a result, they got pummeled by the market, forcing them to sheepishly seek government bailout funds. In this situation, executive salary caps are a brilliant proposal. If the firms do not like the caps, they could try getting bailed out by the market, but they will find that the market will most likely not come to their rescue. The market system will allow the firms to go bankrupt because of their poor performance. That is what the market system does to firms that perform poorly. Obama's limit is set at "only" $500,000 per year and lasts until the bailout funds are fully repaid by the firm.


The argument against the salary caps proposed by Obama is that these firms will lose good executives because they can be paid more elsewhere. But is this necessarily a problem? There are undoubtedly many capable people with better understanding of risk management and liquidity who would be happy to work for these firms for $500,000 per year. If the firms find that they cannot retain the best executives, then they will find themselves with a greater incentive to refund the taxpayer money that much sooner. If the executives who are running these firms want to earn more than $500,000 per year, they will have to get their firms back in shape and earn enough profit to repay the bailout money. An argument can be made that shareholders can oust poorly performing executives and limit executive pay by changing a corporation's board of directors. This argument is a diversion, as can be seen in an article named Shareholder Power from the Christian Science Monitor.

Let the Kim Kardashians of the financial sector go seek out new firms to mismanage!

Discussion Questions

1. Do you agree with this author's viewpoint about bans on enormous salaries? How about his viewpoint on Obama's executive pay cap plan? Is there inconsistency in his views? Is there inconsistency in yours?

2. How do you feel about America's progressive income tax system? If you were in control of the federal government, what would you do to change it, if anything?

3. What do you think about the concept that government should stay out of the free enterprise system? Do you believe that government involvement has made the global financial crisis worse, or has it helped moderate its severity?

4. Suppose that the U.S. did enact a law against anyone earning over $1 million per year. What would the corporate CEOs, celebrities, athletes, and other top earners do in response? Would they leave the country? What other complications might arise from such a law?

Labels: , , ,

Friday, October 10, 2008

The Federal Reserve's Expanding Toolkit


On October 8 and 9, major central banks in Europe, the Americas, and Asia took the exceptional step of reducing interest rates in concert to stave off a global economic slowdown during the ongoing financial crisis.


The financial crisis is rooted in the faltering U.S. housing market. Many banks and financial institutions hold assets (such as mortgage-backed securities) that are tied to home loans. As house prices fall and more Americans have trouble paying their mortgages, these assets lose value, and financial institutions find their holdings are worth far less than expected. Such losses hamper the ability of financial institutions to borrow and lend. At the moment, financial institutions are very reluctant to lend to one another for fear of further exposing themselves to mortgage-related losses.


To combat this crisis of confidence, the Fed is dramatically expanding its role as the lender of last resort in the U.S. financial system. In addition to the coordinated rate cut, the Fed's new policy measures include direct loans to insurers and businesses, as well as an unusual level of cooperation with the U.S. Treasury Department. National Public Radio's Laura Conway catalogues the Fed's expanding monetary policy toolkit here.


Discussion Questions

1. Historically, the Fed's status as lender of last resort extended only to commercial banks. How has the scope of the Fed's lending changed as a result of the crisis?

2. Why don't central banks coordinate monetary policy more often?

3. If effective, how will the Treasury's $700 billion rescue package help the Fed's efforts to restore confidence among banks and financial institutions?

4. What constraints do central banks face in responding to the financial crisis?

Labels: , , , ,

Thursday, September 18, 2008

Financial Market Risks and Negative Nominal T-bill Rates


On September 17, in the immediate aftermath of the Lehman Brothers bankruptcy, the AIG bailout, and the mortgage crisis, negative nominal Treasury bill rates briefly appeared for the first time since January 1940. As Madlen Read points out, a negative nominal Treasury bill rate implies that “investors were willing to take a small loss on the security.”

At first glance, such behavior on the part of seasoned investors seems odd. Why pay more for a security than the amount the US Federal government guarantees to pay you in the future1? One possibility would be that the general price level could fall so that the smaller future payment would represent more purchasing power than the current price of the security. That is, if the price level falls enough, the $1000 payment one receives in several months could buy more than, say the $1000.05 price of the bill could buy today. There is some evidence for this: the US Bureau of Labor Statistics reports that in 2008, on a monthly basis, the percentage change in the CPI was 1.1% in June, 0.8% in July, and –0.1% in August. However, if that is the case, one would still get more purchasing power by holding the $1000.05 in cash through the period of falling prices than by receiving only $1000 in the future. Yet, where can such cash be stored safely?

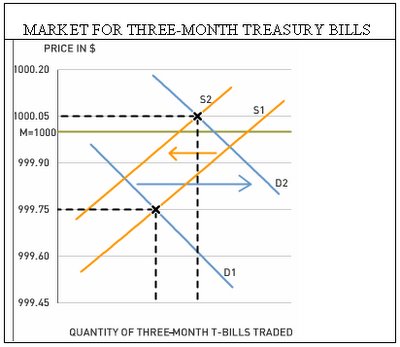
A more likely explanation is that growing fears of systemic risk have discouraged investors from holding any but the safest financial assets. One example of systemic risk comes from the Reserve Primary Fund, the oldest U.S. money-market fund, which lost two-thirds of its asset value due to its investment in Lehman Brothers’s debt. Wary investors fear that similar losses could threaten other financial institutions. Since US Treasuries are generally considered to be the safest investment possible, there was apparently a rush to invest in these securities. Therefore, an increase in demand for T-bills was likely accompanied by a reduced willingness to sell such securities. The latter represents a decline in the supply of T-bills. Both sides of the market then acted in unison to push up the price of T-bills to such an extent that their sales prices briefly exceeded their maturity values. The maturity value, represented on the graph below by the M=1000 line, is the amount, typically $1000, that the bill specifies will be paid to the owner at maturity.


We can solve for the negative nominal rate mathematically using the following formula:


where M is the bill’s maturity value, PB is the bill’s price, and r is its annualized rate of return on the bill when it is held to maturity.

To illustrate the negative rate phenomenon, suppose that for a $1000 maturity value, the market trades a 3-month T-bill at a price of $1000.05. The nominal rate of return, r, is therefore –.02%.

Negative nominal rates were described here in the context of the Japanese market by Daniel L. Thornton in the January 1999 issue of "Monetary Trends." In the article, Thornton states that “investors are willing to accept a negative nominal return on a risk-free asset because holding it is cheaper and less risky than transporting and storing cash.” So it seems that for one day at least, investors were willing to lock in a nominal loss on a safe asset rather than risk leaving cash in financial institutions.

Discussion Questions
1. The Lehman Brothers bankruptcy, the AIG bailout, and the mortgage crisis have apparently shaken investor confidence in financial institutions. Do you think their fears are justified? Do you believe that these financial events have had an impact on your life? If yes, how, and if not, then why not?

2. How might forecasts of a falling general price level in the near future help to explain investors' willingness to accept negative nominal T-bill rates?

3. The dramatic shifting of funds into the safety of Treasuries implies that funds left other sectors. With many financial sites available, you can find information the returns on various financial assets online. Which investment sectors had the largest declines on Sept. 17, 2008? Which investment sectors had the largest gains on that day? How would you explain the results that you found?
-------------------------------------
1 Recall that T-bills have zero coupons which means that they make no payment until the maturity date.

Labels: , , , , ,

Friday, May 26, 2006

Saving Early


Countless surveys and reports show that a majority of Americans, regardless of age, are woefully financially illiterate. The U.S. personal savings rate has been steadily declining over the past decade, even turning negative in 2005. According to many pundits, the problem is that youngsters are not learning financial responsibility and the importance of saving for the future. These bad habits follow them as they get older.

To fight this trend, some schools are promoting financial literacy at a young age and even starting savings banks. At Sunrise Valley Elementary School in Fairfax, Va, students operate the Sunrise Valley Savings Bank, a school branch of a local bank. There is no minimum balance and student deposits earn 5% annual interest.

Elsewhere, educators and financial institutions have sprung into action, teaching kids about basic money management skills. Indirectly, students will be learning about the power of the time value of money. The TVM is a central topic in finance and revolves around the concept that a certain amount of money received today is worth more than the same amount received sometime in the future. A variety of factors including inflation and the choice to consume or save play a role in this.

The basic TVM equation solved for future value: FV = PV (1 + r)n, where PV is the present value of the amount, r is the interest rate, and n is how long the amount is invested. The story mentions how a ten-year-old student, Nate, is depositing a $5 bill. If Nate continues to earn 5% on his savings until he retires at age 65, that $5 deposit will be worth $73.18, doubling nearly four times. If Nate continues his practice of saving $2 a week until he retires, he would have $30,414 when he retires. This is a slightly more complicated calculation, because there is a periodic payment being made, but trust me it’s right!

1. Near the end of the article, 11-year-old student William says he wants to buy a new skateboard. What is his opportunity cost of saving for a new skateboard?

2. The Sunrise Valley Savings Bank pays its members 5% interest, but it is reasonable to assume students will get higher returns for their money in the future. How much will Nate’s $5 deposit be worth in 55 years if he earns 6% interest? 8%? 10%?

3. To see the importantce of teaching youths to save early, access this savings calculator. If a 10-year-old student saved $1 every day and deposited $365 at the end of each year from now until retirement (at age 65), how much would he/she have at retirement in 55 years? (Hint: Starting amount = $0; Years = 55; $365 additional contributions made annually; and a 10% rate of return compounded annually)

4. Use trial-and-error with the savings calculator to see what annual contributions another student would have to make if he/she didn’t start saving until the age of 55 (ten years from retirement) and wanted the same ending amount. (Hint: Change Years to 10 and try different values for additional contributions until you have about the same ending amount.)

Labels: , , ,