Thursday, October 30, 2008

2008 Nobel Prize in Economic Sciences


The Royal Swedish Academy of Sciences recently awarded the 2008 Nobel Prize in Economic Sciences (PDF) to Paul Krugman of Princeton University. Krugman showed how economies of scale can help to explain patterns of trade and the location of productive activity. His research into international trade developed a new trade theory that explained trade patterns that previous theories could not. The model that he developed for international trade also became useful for analyzing economic geography.

Before the publication of Krugman's seminal articles, international trade theory was dominated by the concepts of comparative advantage and factor-proportions. The former was due to the insights of David Ricardo, who emphasized opportunity costs as the basis for the gains from international specialization and exchange. Eli Heckscher and Bertil Ohlin further developed the theory by examining cross-country differences in factors of production as the basis for trade patterns. These traditional theories are good at explaining observed trade patterns between a developed nation and a low-income nation.

However, these traditional trade theories are not able to explain the vast majority of trade flows among developed nations. These trade flows, called intra-industry trade, involve trade within the same industries. Such trade does not conform to the traditional theories because opportunity costs and factor proportions are often similar in the nations that exchange products from the same industry. For example, automakers in the U.S. export cars to Japan, and Japanese automakers export cars to the United States. This can't be explained by the Ricardian concept of comparative advantage.


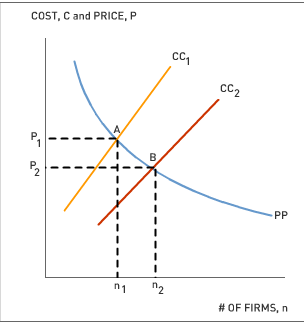
Krugman was awarded this year's Nobel Prize in economics in part because his models of international trade can explain such intra-industry trade as resulting from monopolistic competition, economies of scale, and consumer preference for product diversity. Krugman's model can be illustrated in a graph like the one above, which examines the relationship between the number of firms, the average cost of production, and product price in monopolistically competitive industry. Specifically, the CC curves represent the relationship between firms' average cost of production and the number of firms in an industry, and the PP curve represents the relationship between product price and the number of firms in an industry.

Recall that in a monopolistically competitive industry, firms produce products (like cars) that may differ in quality and style. As more firms enter a given market, each produces less, and average costs increase; therefore, the CC curves are upward sloping. At the same time, more firms mean more competition, which drives prices down; therefore the PP curve is downward sloping.

Where does trade come in? Well, suppose there are automobile producers in the U.S. and Japan. If there is no trade between the two countries, only a certain number of car types will be supported by the sizes of these two markets. But if the two countries can trade, then firms in both countries can sell to consumers in both countries, because some American consumers will prefer Japanese cars and vice versa. This increase in the size of the market means that the automakers are able to produce more cars at lower average cost by taking advantage of economies of scale. In Krugman's model, this causes the CC curve to shift from CC1 to CC2. Consequently, the market equilibrium moves from A to B, which results in a lower equilibrium product price, P, and a greater number of firms, n, producing for the industry. Consumers also benefit from a wider range of available product varieties .

Another important aspect of Krugman's work that was cited by the Nobel committee is the extension of his model to explain the location of economic activity, work that is credited with developing the field of economic geography. It helps to explain the core-periphery pattern of urbanization and migration seen in much of the world. Krugman also made noteworthy contributions to research on strategic trade policy and currency crises. Several pages summarizing his research are presented in the Nobel Prize committee's scientific background paper (PDF).

Discussion Questions

1. Paul Krugman is, for an academic economist, relatively well-known by the public due to his numerous television appearances, books, and articles in the popular press. Some academic economists have been critical of contributions that are easily accessible to the public. Do you believe that such less-scholarly work by Krugman detracts from or adds to the respect he has gained for the contributions which have earned him the Nobel Prize?

2. In what industries besides automobiles do we observe trade patterns which conform to Krugman's theory?

3. What are some of the drawbacks to globalization? Do you think that globalization has had a negative effect on your life, a positive effect on your life, or has had little impact on you? Explain.

Labels: , , , , ,

Wednesday, May 21, 2008

The Hanger Hang-Up


According to a recent NPR story, dry-cleaning costs increased substantially after the U.S. imposed import tariffs on wire hangers from China—so much so that many dry cleaners are now soliciting customers for unused hangers. The U.S. imposed the tariffs after several American producers made dumping accusations against Chinese producers. Dumping occurs if a Chinese firm sells hangers in the U.S. for significantly less than it sells the same hangers for in China, or for significantly less than it costs to produce the hangers in China. The U.S. International Trade Commission found that Chinese manufacturers were, in fact, dumping hangers in the U.S. market.

Economists tend to be skeptical of trade restrictions based on the anti-dumping argument. In markets for standardized goods (like wire hangers) with relatively free entry and exit, there's no long-term benefit from selling a product at below cost. While legitimate cases of dumping certainly come up, some cases may simply involve domestic firms that want to protect their market position from lower-cost foreign manufacturers. In the case of hangers, the tariffs benefit U.S. manufacturers at the cost of the dry cleaners and consumers who would otherwise benefit from lower-priced Chinese imports.

Milton Magnus III, owner of one of the U.S. manufacturers that filed for the anti-dumping duties, argues that the costs to consumers are negligible—amounting to a penny or two per hanger. "If I pay $12.95 to have my suit cleaned and that hanger cost him a cent and a half more, that's $12.96 and a half. It's not a factor." Magnus's point partly explains why import-competing industries often succeed in their efforts to lobby government for the imposition of trade restrictions: the tariff offers concentrated benefits to a few domestic firms, while the costs of the tariff are spread out among millions of consumers—none of whom see a sharp increase in price. Of course, over millions of hangers, a penny or two per hanger can add up.

Advocates of trade restrictions often argue that protection will save jobs. Since we can observe price and cost increases associated with trade restrictions, we can estimate how much it costs to save each job in a protected industry. According to the NPR story, there are roughly 30,000 dry cleaners in the U.S., and on average, each pays an additional $4,000 per year due to the hanger tariff. This indicates an average annual cost of 30,000 firms x $4,000 per firm = $120 million. According to the U.S. International Trade Commission's report, U.S. employment in wire hanger manufacturing was 564 workers in 2004 and fell to 236 workers by 2006. Let's assume that employment in this sector would have fallen to zero in the absence of the tariff, and that with the tariff, employment will recover to 2004 levels. In other words, assume the tariff "saves" 564 jobs. Dividing the cost of the tariff to U.S. dry cleaners ($120 million year) by the number of jobs saved (564 jobs) indicates that each job saved costs about $212,765 per year. Keep in mind that the typical full-time worker in this sector earns about $30,000 per year. Even if we assume that industry employment doubles, the cost of the tariff is still roughly $120,000 per job.

Discussion Questions

1. Our cost estimates ignore possible job losses in the dry-cleaning industry. How would this impact the overall cost of the trade restrictions? Will dry cleaners organize to oppose the tariff on wire hangers from China?

2. According to the Trade Commission report, China provides tax rebates to firms that export items that use steel (such as wire hangers). As of July 2007, the tax rebate amounted to 5% of the value of exports. How do you think export subsidies or tax rebates should factor into government analysis of trade policies?

3. The story mentions dry cleaners' attempts to reclaim and reuse wire hangers. Are there inadvertent environmental benefits from the tariff? Could the U.S. government encourage dry cleaners and their customers to reuse wire hangers without resorting to tariffs on Chinese manufacturers?

Labels: , ,

Wednesday, December 12, 2007

Honduras: Hosed by Sock Tariffs


In 1984, the U.S. government gave Honduras unfettered access to the American sock market. The move was the first of several trade deals that would ultimately unravel Fort Payne, Alabama's status as the sock capital of the world. Fort Payne's sock factories struggled to compete with the likes of Honduras, China, and Pakistan when it came to the labor-intensive step of seaming sock toes. American workers receive approximately 2 cents per seam (at about six seconds per sock, a good hour would bring in $12), but foreign workers sew for half of that. The labor savings add up over millions of socks. The cost disadvantage forced many Fort Payne sock mills to shutdown and lay-off workers.

Keep in mind that many people benefited from U.S. openness to trade in socks and other goods. Americans gained access to a wider variety of less-expensive goods—socks included. American firms and workers in U.S. export industries benefited from access to foreign markets. A cosmopolitan view also acknowledges the gains to firms and workers in developing countries. The Honduran sock industry thrived on access to the American market, generating more jobs and higher wages for workers. Of course, none of this is of much solace to a laid-off sock worker in Fort Payne.

A number of Fort Payne sock mills managed to hang on, but much of the town's industry consists of relatively new ventures, like bridge building and label making, with no relation to hosiery. As a recent two-part story (here and here) from NPR's Adam Davidson illustrates, Fort Payne's dynamic economy absorbed its losses from international trade—creating new, often better-paying jobs for many of the workers initially displaced by globalization. Even as Fort Payne's economy moved on, the political clout of the sock industry remained strong. Alabama congressman Robert Aderholt struck a deal with President Bush in 2005—Aderholt would support the Central American Free Trade Agreement (CAFTA) if the president agreed to re-impose tariffs on socks from Honduras. The president agreed; CAFTA moved one step closer to full implementation; and the administration gave itself a deadline for resurrecting the sock tariff—December 19, 2007. Read Davidson's report to learn more about the potential impact of rolling back free trade with Honduras.

Discussion Questions

1. How did sock tariff removal initially impact Fort Payne? How does the economy in Fort Payne look today? Would you characterize it as a sock dependent town?

2. How will the re-imposition of the sock tariff affect the historically small number of sock mills and sock workers in Fort Payne? How will the tariff affect sock mills and workers in Honduras? How will the removal of duty-free status for Honduras impact other developing countries, such as China, that currently face higher U.S. trade barriers than Honduras?

3. The president acceded to representative Aderholt on sock tariffs for Honduras in order to get a vote for CAFTA--a wide reaching agreement that has the potential to reduce trade barriers among multiple countries. Was the deal worth it?

4. Fort Payne's economy adapted to life with open trade, but not all workers experienced a smooth transition from the sock-based economy. According to Davidson's story, how have workers had to adapt to the new labor market in Fort Payne? What, if anything, is the appropriate role for government in easing the adjustment to globalization in towns like Fort Payne?

5. Think about the local, regional, or national economy. How would life be different today if everyone, everywhere were producing the same stuff that they were 30 years ago?

Labels: , ,

Tuesday, October 09, 2007

The Dollar Is Sinking, but What Does That Mean to Me?


Last week, the U.S. dollar continued its downward spiral against most major currencies, including an all-time low against the euro. The previous week, the U.S. dollar had begun trading at parity with the Canadian dollar—something unfathomable 10 or 20 years ago. An earlier Aplia Econ Blog post discussed the role of monetary policy and the effect of the Fed's rate cut on exchange rates.

The graph below illustrates how the U.S. dollar has performed relative to four major currencies (the euro, British pound, Canadian dollar, and Japanese yen) over the last decade relative to their January 1, 2000 values. But what effect do declining exchange rates really have on us?

At the consumer level, it's fairly simple—a weaker dollar means our purchasing power is weaker when buying foreign goods. Effectively, imported goods become more expensive, since the U.S. dollar can buy fewer euros, for example. However, there is another side to this story, because it also means that U.S. goods are cheaper to foreign consumers. This is one of those things that sounds bad, but depending on who you are, can actually be quite good. If you are a U.S. firm, a weaker dollar can be beneficial because it enables foreign consumers to buy more of your products.

In fact, a weaker U.S. dollar is beneficial to U.S. multinationals in a more fundamental way. When a firm sells abroad, it generally sells its goods at a price denominated in the currency of the foreign country it is dealing in. Ultimately, the U.S. firm's shareholders care about dollar-denominated revenues and profits. A declining U.S. dollar means that a firm's euro-, pound-, or yen-denominated revenues can be exchanged for more U.S. dollars than they could have been when the U.S. dollar was stronger. Hence, a U.S. multinational that transacts in several currencies benefits when the dollar declines because its foreign revenues are worth more on a U.S. dollar basis, and vice versa. For example, in the mid- to late 1990s, many U.S. multinationals selling in Asia experienced phenomenal sales growth, yet their profits grew only modestly. During this period, the Asian currencies weakened, decreasing the worth of these firms' revenues in U.S. dollars. Hence, record-breaking unit sales translated into only modest profits in terms of U.S. dollars.

Discussion Questions

1. Who has a greater interest in a strong U.S. dollar—U.S. consumers or U.S. producers?

2. What sort of tax implications may exist for U.S. multinationals as a result of fluctuating exchange rates, especially a weaker U.S. dollar?

3. If a firm owes €100,000 to a German supplier due in 30 days (an account payable), does it prefer that the U.S. dollar strengthen or weaken relative to the euro?

4. Suppose a different firm is owed ₤88,000 from a UK customer due in 45 days (an account receivable). The spot exchange rate is $2.01/₤. How much (in U.S. dollars) would the firm receive if it were paid today? Discuss the gain or loss implications for the firm if the money isn't received for 45 days and the exchange rate moves to either $2.10/₤ or $1.90/₤ during that time.

Labels: , ,

Thursday, March 01, 2007

Inflation Gone Wild


With an annual inflation rate of 1,600%, Zimbabwe currently holds the world title for fastest-increasing prices. As the late Milton Friedman put it, “Inflation is always and everywhere a monetary phenomenon. To control inflation, you need to control the money supply.” The inflation cure seems simple to understand from a textbook perspective: drastically cut back the money supply in order to lower the expected inflation rate.

Unfortunately, the cure might be worse than the disease. With the current unemployment rate at 80%, drastic cuts in the money supply could increase unemployment and cause a coup d'état before the expected inflation rate falls. The monetary contraction is inevitable if Zimbabwe wishes to tame the inflation monster, and the International Monetary Fund has urged the government to liberalize its exchange rate regime as a means to cushion the unemployment effects.

In order to understand the IMF’s position on Zimbabwe’s exchange rate, we must examine how maintaining an overvalued currency might contribute to soaring inflation, and how floating the currency might provide relief to both inflation and unemployment.

The graph on the left shows the market for Zimbabwean dollars. Assume that the government fixes the exchange rate at E1. A fixed exchange rate is the official value of the currency despite fluctuations in supply and demand. Initially, the official value equals the market value where D1 intersects S1 (point A). Then, due to unsustainable fiscal deficits and government land reforms that usurp private property, foreign investors flee Zimbabwe. Consequently, the demand for Zimbabwean dollars decreases from D1 to D2.

If Zimbabwe were under a floating exchange rate regime, the fall in demand for Zimbabwean dollars would result in the depreciation of the currency from E1 to E2 (point B). But because Zimbabwe’s government insists on a fixed exchange rate regime, the fall in demand for Zimbabwean dollars will cause a surplus of Zimbabwean dollars (Q1 - Q2). At point C, the currency is considered overvalued because the official value is greater than the market value. In order to eliminate downward pressures on the currency, Zimbabwe will instruct its central bank to buy the surplus of Zimbabwean dollars (and sell U.S. dollars), which will return the market to point A. Zimbabwe's central bank will eventually deplete its U.S. dollar reserves as the economy deteriorates from questionable domestic policies, and will borrow U.S. dollars in order to maintain the fixed exchange rate.

Since the loans are denominated in U.S. dollars, Zimbabwe must make periodic payments in U.S. dollars or face getting cut off from all sources of international capital. Due to disastrous domestic policies, the government has little tax revenue to make those periodic payments, and the only way to service their international debts is to print more money, just as Germany did after World War I. As the central bank expands the money supply to pay international debts, inflation increases, which places additional downward pressure on the Zimbabwean dollar: as foreigners demand less and less of the failing currency, Zimbabwe has to print more and more money, and sooner or later, everything will spin out of control.

One solution is to eliminate the fixed exchange rate regime altogether and allow the Zimbabwean dollar to float freely. If the currency were allowed to float today, its value would fall tremendously, which would stimulate exports and reduce imports. The graph on the right shows that as the exchange rate falls from E1 to E2, net exports increase from NX1 to NX2. A floating exchange rate would boost job creation as the central bank institutes the tough medicine of curing inflation by drastically reducing the money supply.

Discussion Questions

1. If the fixed exchange rate regime were eliminated, what would happen to the size of Zimbabwe's international debts in terms of Zimbabwean dollars? Would it increase or decrease?

2. The central bank has recently declared inflation illegal. How do price controls affect domestic markets like those for corn, wheat, electricity, and labor?

3. This analysis assumes that Zimbabwe's reduction in real GDP is due to domestic policies such as unsustainable fiscal deficits and poor private property rights. How might hyperinflation directly contribute to higher unemployment?

Labels: , , , , , ,

Tuesday, July 25, 2006

A Tale of Two Dragons: China's Trade Surplus and Inflation


In Chinese mythology, dragons can bring prosperity or destruction to villages and empires. China currently faces two dragons: the trade surplus that brings prosperity to Chinese manufacturers and urban workers, and inflation, which threatens China's price stability. Bloomberg reports that China's trade surplus might be fueling China's inflation problems.

One possible explanation is that the increase in the trade surplus outpaces the increase in potential output. Net exports are one component of aggregate demand in China. An increase in net exports pushes the aggregate demand curve to the right. Potential output increases as China utilizes more of its work-force (labor-intensive growth) and increases its capital stock (capital-intensive growth). The graph below shows that the increase in potential output (LRAS1 to LRAS2) is less than the increase in aggregate demand (AD1 to AD2). Whenever the increase in aggregate demand exceeds the increase in potential output, inflation is sure to follow (for example, from SRAS1 to SRAS2).
1. China maintains a relatively fixed nominal exchange rate between the yuan and the U.S. dollar (nominal exchange rate = 8 yuan per U.S. dollar). The real exchange rate is the nominal exchange rate times the ratio between the U.S. price level and the Chinese price level. The real exchange rate also represents the cost of U.S. goods and services relative to Chinese goods and services. How does an increase in China's inflation rate affect the real exchange rate?

2. How does an increase in China's inflation rate affect the trade balance between the United States and China?

3. The People's Bank of China often keeps its nominal interest rate equal to the United States' nominal interest rate in order to maintain the fixed nominal exchange rate (interest rate parity). Can the Bank of China choose to fight inflation and keep the nominal exchange rate fixed?

Labels: , , , , ,

Friday, June 16, 2006

An iTunes Index for Exchange Rates


This week, The Economist celebrated the 20th anniversary of its Big Mac Index. The newspaper regularly examines how current exchange rates compare to purchasing power parity (or PPP). The price of a standardized commodity that is otherwise locally produced, like Big Macs or Starbucks Lattes, is compared across countries. According to PPP, exchange rates should adjust so that a consumer's purchasing power is the same across countries. Big Mac prices can, therefore, give an indication as to where PPP exchange rates should be.

Of course, Big Mac prices build in the differences in local production costs between countries. For example, the price of beef is lower in Australia than in Japan, and Australian Big Mac prices reflect the lower input cost. Perhaps a standardized commodity that is free of variations in local costs would provide more accurate PPP exchange rate estimates.

Consider individual song downloads on iTunes. Like Big Macs, their pricing is set by a single firm--in this case, Apple. Unlike Big Macs, we can expect that there are no local variations in costs. Apple negotiates with the same music company (Sony, BMG, etc.) for the rights to digital provision of a given song. Hence, any cross-country differences in download prices likely arise from differences in demand.

There are many iTunes stores but only nine distinct local currency prices for iTunes downloads. The price of an iTunes download in the United States is US$0.99. The following table shows the price of downloading a song on iTunes in eight additional currencies. The second row shows the PPP exchange rate. This is simply the local price of an iTunes download divided by the American price (US$0.99). For example, iTunes prices suggest a PPP exchange rate of A$1.70 per US$1.00 between Australia and the United States (A$1.69 / US$0.99).

The third column shows the actual dollar exchange rate as of May 22. For example, the actual exchange rate between Australia and the United States was A$1.33 per U.S. dollar. The PPP exchange rate implied by iTunes prices suggests that the Australian dollar is overvalued--that is, it should take more than A$1.33 to purchase an American dollar (since it takes A$1.69 to buy an iTunes download worth only US$0.99 in the United States). The fourth column indicates whether a currency is over (+) or under (-) valued against the dollar according to the PPP exchange rate.

The final two columns show the local currency prices of Big Macs and the under or over valuation of each currency against the dollar when Big Mac prices are used to compute PPP exchange rates. The price of an American Big Mac on May 22 was $3.10.


There are two things interesting to note here. First, apart from Canada, iTunes songs are priced at a premium over the United States in all other music stores. Second, there doesn't appear to be a positive relationship between the PPP exchange rates implied by the iTunes and Big Mac indexes.

In theory, if Apple based its iTunes pricing optimally on long-term forecasts of exchange rates, then the iTunes Index should out-predict the Big Mac Index for exchange rate movements, as it is free of local variation. Only time will tell on that.

1. Apple appears to be practicing international price discrimination in its iTunes pricing. Usually, the richer the country, the higher the price. However, the United States has the highest GDP per capita but the second lowest prices. Can you think of any cost differences that might account for this? Can you think of reasons why the elasticity of demand for paid downloaded music is lower in Japan and Australia than in the United States? Do you think Apple is pricing optimally?

2. Big Mac pricing is probably more flexible than iTunes pricing. Apple may find it hard to change iTunes pricing once it announces a price point. What does this suggest about the relative merits of each as a predictor of PPP exchange rates? Does this suggest that iTunes may face some painful pricing realignment in the future?

3. Can you think of other commodities that might provide appropriate standards for predicting PPP exchange rates?

4. How do the other exchange rates compare using the Big Mac and iTunes instance? For example, calculate the Australia-Japan exchange rate and see how the relative prices for iTunes and Big Macs differ from these.

Joshua Gans is Professor of Management (Information Economics). The iTunes Index was first suggested by him earlier this year on his blog, economics.com.au.

Labels: , ,