Thursday, August 13, 2009

The Demand for Natural Light


I once participated in a blind taste test involving eight light beers. Faced with eight un-marked cups, I was certain I’d prefer the priciest, and presumably classiest, light beer in the field. Alas, I chose Natural Light. For me, the cheap and down-market “Natty Light” is the choicest light beer on offer. But people who have (or think they have) a more refined palate gladly pay for a more expensive option like Heineken or Bud Light.

With the economic downturn, however, cash-strapped beer drinkers appear to be switching to cheaper beers like Busch, Natural Light, and Keystone. As average incomes declined in the United States, sales of these cheaper options have increased substantially. Meanwhile, sales of ‘premium’ brands like Budweiser and Heineken were reportedly down 18% and 14% respectively from a year ago in July 2008.

Discussion Questions

1. If, other things being equal, a reduction in average income leads to an increase in the demand for Natural Light, what type of good is “Natty Light”? If, during the same period, the demand for Bud Light declines, what type of good is Bud Light?

2. What additional information would be useful if you were trying to use changes in average income and beer sales to determine whether a particular brand of beer was a normal or inferior good?

3. What strategy might a large beer company adopt to protect itself from an economic downturn?

4. Information Resources, Inc. reports that sales of Bud Light were down about 7% from a year ago in July 2008. Let’s assume that the price of Bud Light is fixed, so that the percentage decrease in sales is the same as the percentage decrease in the quantity of Bud Light demanded. Assume that personal income per capita in the United States declined by about 3.4% over the same period. Keeping in mind that factors other than income probably affected Bud Light sales over this period, use these numbers to come up with a rough estimate of the income elasticity for Bud Light. Is the income elasticity of demand for Bud Light elastic or inelastic? Would you characterize Bud Light as a luxury or a necessity?

Labels: ,

Thursday, July 17, 2008

California's Foil Balloon Problem


A helium-modified voice is good for a laugh, but the joke is risky. Inhale too much helium from the balloon and you'll pass out. It turns out that helium balloons can black out more than just the overzealous prankster. As recent news stories point out, foil helium balloons can get caught up in power lines and cause outages. California utilities reported hundreds of balloon-related outages last year: 211 for northern California's PG&E and 478 for southern California's Edison. California Senate Bill 1499 proposes to deal with the problem by banning foil balloons and fining violators. Though foil balloons can be a problem, a bit of economic analysis suggests that the heavy-handed ban may not be the best remedy.

By increasing the odds of costly power outages, helium balloon consumption imposes external costs on society. The vast majority of electricity consumers outside of the helium balloon market may nonetheless end up incurring some costs when errant balloons make their way into nearby power lines. Since helium balloon consumption imposes external costs, the social benefit of helium balloon consumption is considerably less than the private benefit. When the social value of a good is lower than the private value, there will be an inefficiently high level of consumption in the private market.

So rather than banning the balloons altogether, the California legislature may want to consider a corrective tax. Taxing the consumption of helium balloons would force buyers to internalize the heretofore external costs that the balloons impose on everyone else. The tax would reduce both foil balloons purchased and balloon-related power outages while giving buyers and sellers an incentive to shift toward less disruptive party favors.

To analyze the issue more closely, we need to define some costs and benefits in the market for foil balloons. Because helium balloon consumption generates external costs, the marginal social benefit from a helium balloon will be less than the marginal private benefit:

Marginal Social Benefit (MSB) = Marginal Private Benefit (MPB) – External Cost

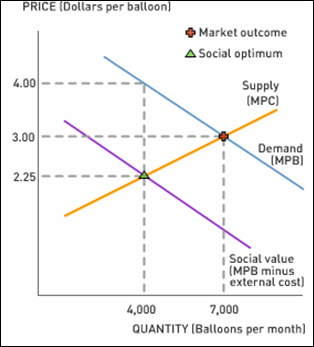
In the foil balloon market, the supply curve represents the marginal private cost (MPC) of selling balloons and the demand curve represents the marginal private benefit (MPB) of consuming balloons. The marginal social benefit (MSB) curve lies below the demand curve, since the social value of foil balloons incorporates the external costs. The socially optimal output level occurs where the marginal private cost of producing the balloons is equal to the marginal social benefit of consuming them—well below the market outcome at the intersection of our standard supply and demand curves. At points above the socially optimal output level, the marginal social benefit of the balloons will be less than the marginal cost of producing them. As a result, at least some of the current balloon consumption is inefficient.


Discussion Questions

1. According to our diagram of the hypothetical helium balloon market, what is the size of the tax necessary to achieve the socially optimal output level? Can you think of other markets where corrective taxes have been used or might be used to curb the external costs of consumption or production?

2. Is a ban more costly than a corrective tax in this case? Not all helium balloon buyers are careless with their purchase. Is the tax fair?

3. While a corrective tax has the potential to move a market closer to its social optimum, the use of government revenue from such taxes may be socially inefficient and wasteful. The correction of a market failure may simply beget government failure. Can you think of ways to prevent the government from wasting corrective tax revenues?

4. How would you go about estimating the external costs of helium balloon consumption?

5. What can you say about the price elasticity of the demand for and supply of helium balloons? Many party supply stores claim that any disruption to helium balloon sales will threaten jobs. What do you make of this?

Labels: , , ,

Monday, February 12, 2007

Fueling Protests and Cars


Tortillas—a central component of the Mexican diet—have been a source of recent uproar in Mexico. Rising tortilla prices fueled protests in Mexico City two weeks ago. Many people in Mexico earn only $5 per day, and with the price of tortillas approaching $0.45 per pound, protests were inevitable.

Tortilla prices may be fueling the protests, but it's the growing demand for corn among American ethanol producers that's fueling the rise in tortilla prices. As more and more ethanol plants come online in the U.S., the number of buyers in the corn market increases, putting upward pressure on corn prices. Rising corn prices mean rising input prices for tortilla makers and rising tortilla prices for consumers. So does fueling your Honda Accord with ethanol-laced gasoline take tortillas off the plates of Mexicans? The answer depends on the time horizon: the short run or the long run.

Three characteristics in the market for corn make it highly competitive. First, there are many corn producers in the United States, Mexico, and the rest of the world. Second, corn tastes about the same no matter which farmer sells you the corn. Third, there are few barriers to new corn producers entering the market in the long run.

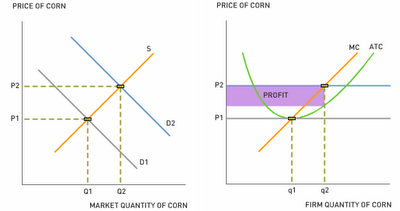
In the short run, however, firms cannot exit or enter the market. Rising ethanol production in the U.S. creates a higher demand for corn. The market demand for corn shifts to the right from D1 to D2, increasing the price of corn from P1 to P2. Corn producers react to the higher price by producing more corn (moving from q1 to q2). The higher demand for corn also causes corn producers to earn an economic profit.

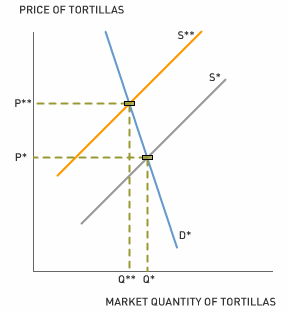
How does this affect the tortilla market in Mexico? Corn is a major input for tortillas—as corn prices rise, the cost of tortilla production rises. The supply of tortillas shifts to the left from S* to S**. The price of tortillas increases and the quantity of tortillas consumed decreases. The reduction in tortilla supply causes the price of tortillas to rise sharply in Mexico because tortillas are essential to the Mexican diet (the demand for tortillas is fairly inelastic). As a result, the financial burden of higher corn prices falls on tortilla consumers more so than the producers.

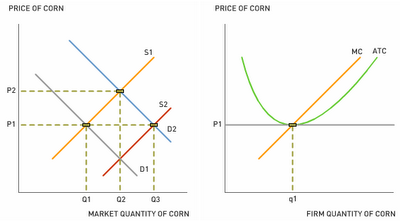
Fortunately, as the Los Angeles Times reports, help is on the way for the people of Mexico. In the long run, firms may exit or enter the market. Unusually high short-run profits in the corn market will undoubtedly cause more farmers to plant corn in the long run. As they do, the supply of corn will shift to the right from S1 to S2. As more farmers plant corn in the long run, profits return to normal and the price of corn falls. In the long run, as the diagrams suggest, it's possible that the higher demand for ethanol will have no effect on corn and tortilla prices.


Click here for another Aplia perspective on food prices and ethanol.

Discussion Questions

1. How would a price ceiling at P* affect the Mexican tortilla market?

2. Should the Mexican government subsidize tortilla producers until corn prices fall back to previous levels? How would a subsidy—or voucher—for tortilla consumers affect the tortilla market in the short-run?

3. Are Mexicans worse off or better off due to the increase in U.S. ethanol production?

Labels: , , , ,

Thursday, January 25, 2007

How Sustainable Are High Margins?


Apple’s iPhone is set to launch in the U.S. in June and will be available for $499 (for the 4GB version; the 8GB version will be $599) as part of a Cingular call plan. One analyst, iSuppli, looked at what it would cost to make an iPhone and calculated that a unit would cost $245.83. That is a gross margin of 50.7%. iSuppli concluded that:
For Apple, such a strong hardware profit is par for the course, with the company having achieved margins of 45% and more in products including the iMac and iPod nano, according to iSuppli. However, because Apple is facing extensive competition in the music-phone market, the company may need to cut into its margins to reduce pricing in the future.

“With a 50% gross margin, Apple is setting itself up for aggressive price declines going forward,” said Jagdish Rebello, PhD, director and principal analyst with iSuppli.

But is it the case that a 50% gross margin is unsustainable?

A margin is one thing, but the incentive to drop prices is governed by the elasticity of demand. In particular, the rule of thumb for pricing (also known as the Lerner Index) suggests that in order to maximize profits, Apple should set its retail price (P) so that (P - c)/P = -1/e, where c is marginal cost and e is the price elasticity of demand for the iPhone. So the figures imply that e = -1.97. What that means is that if Apple raised its price by 1%, it would stand to lose almost 2% in sales. That seems plausible.

Discussion Questions

1. Take a look at the breakdown of costs at iSuppli (click here). Do you think that all of these costs are marginal costs paid by Apple?

2. Apple has two versions of the iPhone. According to the iSuppli estimates, the 8GB version costs only $35 more to produce (the cost of additional flash memory). Apple is set to earn a gross margin—(P - c)/P—of 53.1%. Does this suggest that the 8GB iPhone has more or less price elasticity than the 4GB phone? What theory of price setting would you use to work this out?

3. As a gut reaction, what do you think the price elasticity for the iPhone will be when it first hits the shelves? What about six months from now? What could explain any difference between those two time horizons?

Joshua Gans is Professor of Management (Information Economics) at the University of Melbourne. He maintains his own blog at economics.com.au.

Labels:

The Football Price Index and Elasticity


From both sides of the Atlantic this week, we have news reports of increases in football ticket prices. In England, where the word "football" sensibly refers to a sport in which one kicks a ball with one's foot, the Sun proclaims that "Prices will kill football." In the United States, where the same word refers to a game in which one's feet are generally used only to carry the rather substantial weight of an American football player, colleges and professional teams alike are also raising their prices. Case in point: LSU will raise the prices on its base tickets and on fees for season ticket holders.

Whether those price hikes are sensible depends on the elasticity of demand for tickets in each case. In the British case, a survey by Virgin Money shows that attendance has dropped dramatically in the face of price hikes. Just as the CPI uses a bundle of goods to measure inflation, the Virgin survey takes into account the price of a "bundle" consisting of such items as club merchandise, food and drink at the games, and transportation costs for home and away games in addition to the cost of tickets. By their calculations, the inflation rate in this index has been greater than 17%—more than five times that of general prices in England. The impact on attendance has been severe: according to the survey, more than 40% of fans have cut back on their attendance at games.

Of course, prices cannot actually kill football, no matter what the Sun fears. Firms will only continue to raise their prices as long as doing so also raises their revenues. If teams hike their prices by 17% and see attendance drop by more than 17%, they'll see a drop in overall revenue. In general, if we assume that the marginal cost of hosting an individual football fan is negligible, then teams will eventually set ticket prices at such a level that if they were to raise prices, they would lose more money from lost sales than they would make from higher revenue per fan; and if they were to lower prices, they would lose more money from decreased revenue per fan than they would gain in increased sales.

The economic concept used to analyze this situation is elasticity—the ratio of the percentage change in quantity demanded to the percentage change in price. As we can see in the example of the English football league, when the elasticity of demand is less than one (that is, the percentage decline in attendance is smaller than the percentage change in price), teams can raise their prices and see their revenues increase.


Discussion Questions

1. According to the article in the Sun, why are Virgin Money researchers fairly sure the decrease in attendance at games is due to increased costs?

2. LSU has had back-to-back banner seasons. What effect is this likely to have on the elasticity of demand for LSU tickets?

3. Interesting questions of elasticity come into play when firms price discriminate. For example, LSU is raising its ticket prices, parking-lot fees, and motor-home prices, but not student ticket prices. Why do you think this is the case?

Labels:

Monday, January 22, 2007

California Freezing


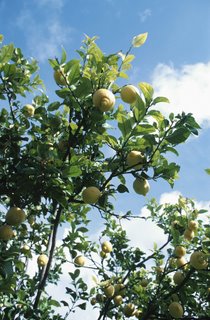
Freezing temperatures destroyed significant portions of fruit and vegetable crops in California over the weekend of January 13. An article from the LA Times documents the cold snap's immediate impact on wholesale prices for citrus. The cold snap will be felt in other markets as well: an article in the Seattle Times assesses potential impacts on apple and pear prices, and a USA Today piece considers the fallout in the labor market for farmhands in California.

Discussion Questions

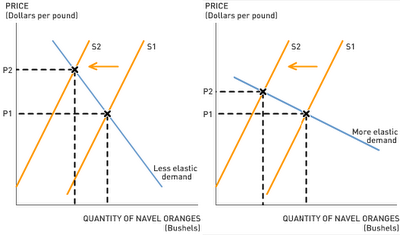
1. According to the LA Times article: "The freeze has left the nation with about 14 million 40-pound cartons of California navel oranges—less than half of what America would eat between now and next season…" The sharp reduction in the supply of navel oranges will cause prices to rise, but by how much? To what extent will consumers substitute away from citrus towards other fruits in response to higher prices? Is demand for navel oranges relatively unresponsive to price changes (less elastic), or will consumers simply switch from citrus to alternative fruits when prices rise (more elastic)?


2. As the LA Times article mentions, California is the major producer of navel oranges for domestic consumption and also exports a significant amount of fruit. Fruit distributors will try to import as much citrus as possible from places like Mexico and Chile. That is, the supply of citrus exports from the U.S. will plunge and the demand for citrus imports will rise. What do you expect to happen to world citrus prices?

3. The USA Today article notes that many California farmhands will be laid off in the wake of the freeze. What will happen to farmhand wages and employment levels in California? Given that undocumented migrant workers will not be eligible for unemployment insurance, what do you expect to happen in markets for low-skilled labor in other parts of the United States?

4. How, according to the Seattle Times article, is the reduction in citrus supply affecting the demand for apples and pears?

Labels: , ,

Monday, August 14, 2006

The Organ Shortage


Newspaper ads on every college campus beckon cash-strapped students to sell their plasma, sperm, or eggs to the appropriate medical intermediaries. It's Adam Smith's invisible hand at work: People need plasma for blood transfusions; students with excess plasma need cash. Plasma banks facilitate the transaction and everyone's better off.

The enterprising student will wonder whether he can collect on other spare parts--say, a kidney. He cannot. The sale of human organs, whether it benefits a living kidney donor or the family members of a recently deceased heart donor, is illegal in the United States. Why, asks the latest Freakonomics column, is selling a kidney illegal in a country where thousands of people die each year waiting for kidney transplants? Read the column to see what Stephen Dubner and Steven Levitt have to say about the organ shortage.


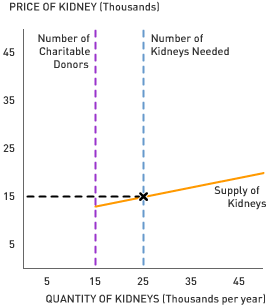
1. Suppose the graph above represents a market for transplantable kidneys from live donors. Under current law, the price of a kidney is restricted to zero. At a zero price, 15,000 people (most likely friends and family of the recipients) supply a kidney to eligible patients each year. What's the shortage of kidneys at a zero price?

2. Beyond the 15,000 charitable donors our hypothetical supply curve takes a more familiar, upward-sloping shape. Each point on the supply curve represents the seller's cost of providing a transplantable kidney. According to Dubner and Levitt, what are some of the costs that influence the supply decisions of living kidney donors? (Think about forgone wages, medical risks, and the fact that supplying a kidney is a one-time event.)

3. In our hypothetical market for kidneys shown in the graph, what price clears the transplantable kidney market? (See an actual economic estimate of kidney prices in this paper by Gary Becker and Julio Jorge Elias.) Notice that closing the kidney shortage with a free market adds to the cost of a transplant (already upwards of $200,000). Might the additional cost of procuring a kidney price some patients out of the market altogether? That is, would an increase in the price of a transplant reduce the quantity of transplants demanded? Do you think the quantity of transplants demanded is sensitive or insensitive to price (is the price elasticity of demand for transplants perfectly inelastic)?

4. If you're like most normal people, the prospect of a market for kidneys raises all kinds of moral and ethical questions. According to the column, Alvin Roth helped devise a program that uses incentives to elicit organ donations from strangers, but stops short of a free market for organs. How does the New England Program for Kidney Exchange align the incentives of non-related donors and recipients without monetary incentives?

5. Kidneys from living donors are preferable from a medical perspective, but usable organs from the recently deceased are important as well. Of course, doctors can't just go around harvesting organs every time someone dies. Americans, usually at the Department of Motor Vehicles, have to sign-up if they wish to donate usable organs upon death. What would happen to the organ shortage in the United States if all Americans were donors by default?

Check out the Freakonomics website for more about creative solutions to the organ shortage.

Labels: , , , ,

Friday, January 20, 2006

Do Renewable Fuels Mean World Hunger?


Sky-high oil prices and concerns over global warming have sparked a debate about renewable energy sources. One such alternative is to use biological fuels (rather than fossil fuels like oil) to power automobile cars. Willie Nelson has started selling BioWillie, a form of diesel made in part from vegetable oil. And ethanol, a form of gasoline made from corn, has begun to take off as a viable alternative to traditional gasoline in cars.

The possibility of using corn to produce fuel is one that is obviously attractive to the nation's corn growers. But if the United States were to start using corn as a significant source of energy, would that mean that the rest of the world would have less to eat? Would poor children go starving just so yuppies could drive their SUVs? This article in the New York Times examines that possibility, but some simple economic analysis shows that these fears are unfounded.

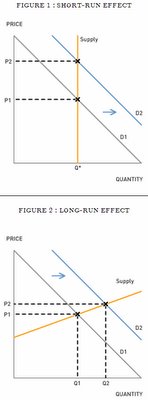
Consider the market for corn in Iowa. Usually, demand in the market comes from animal feed producers and food processors, who make the corn into corn syrup for use in things like Danish pastries. However, this year, demand for corn increased because there are more buyers in the corn market: namely, ethanol producers.

In the short run--that is, after the corn has been harvested in a given year--the supply of corn is fixed. This is sometimes called a momentary supply curve. (You can see the fixed supply of corn in the picture in the article--it's that giant 35-foot pile in the main photo!) Therefore higher demand translates into higher prices, as is shown in Figure 1.

In the long run, though, higher prices for corn will mean that more corn will be produced. (In fact, as the article mentions, the U.S. government actually pays corn farmers NOT to farm 35 million acres of corn.) Because of these agricultural subsidies, in fact, third-world farmers are priced out of the market--so they don't plant corn. Higher demand for corn, in the long run, would mean that both U.S. producers and world producers would have more incentive to plant corn. Therefore, the long-run supply curve of corn is much more elastic (i.e., much flatter) than the momentary supply curve--so the same shift in the demand causes a smaller increase in prices, and enough corn to be planted to satisfy the need for food and fuel, as shown in Figure 2. In the long run, an increase in the demand for corn increases the amount of corn produced and consumed in the world.

1. The article quotes Lester R. Brown, an agriculture expert in Washington, D.C., and president of the Earth Policy Institute, as saying, "We're putting the supermarket in competition with the corner filling station for the output of the farm." Draw a PPF showing how much food and fuel an economy can produce with a given amount of corn. What aspect of your drawing represents the tradeoff that Mr. Brown describes? Now draw another PPF showing how much food and fuel an economy can produce if twice as much corn is planted. In what sense are short-run tradeoffs different from those in the long run?

2. Draw a supply and demand graph of the market for corn. What would happen in this diagram if the United States stopped paying corn farmers NOT to farm that 35 million acres of corn?

3. Much of the corn grown in the United States is used for animal feed. What effect would an increase in the price of Iowa corn have on the market for hamburgers?

4. What other short-run tradeoffs might be rendered irrelevant by long-term market adjustments

Labels: , ,