Tuesday, October 09, 2007

The Dollar Is Sinking, but What Does That Mean to Me?


Last week, the U.S. dollar continued its downward spiral against most major currencies, including an all-time low against the euro. The previous week, the U.S. dollar had begun trading at parity with the Canadian dollar—something unfathomable 10 or 20 years ago. An earlier Aplia Econ Blog post discussed the role of monetary policy and the effect of the Fed's rate cut on exchange rates.

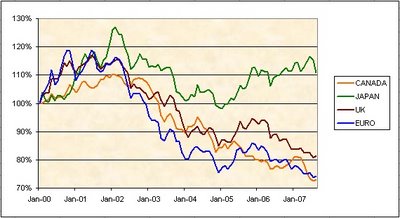
The graph below illustrates how the U.S. dollar has performed relative to four major currencies (the euro, British pound, Canadian dollar, and Japanese yen) over the last decade relative to their January 1, 2000 values. But what effect do declining exchange rates really have on us?

At the consumer level, it's fairly simple—a weaker dollar means our purchasing power is weaker when buying foreign goods. Effectively, imported goods become more expensive, since the U.S. dollar can buy fewer euros, for example. However, there is another side to this story, because it also means that U.S. goods are cheaper to foreign consumers. This is one of those things that sounds bad, but depending on who you are, can actually be quite good. If you are a U.S. firm, a weaker dollar can be beneficial because it enables foreign consumers to buy more of your products.

In fact, a weaker U.S. dollar is beneficial to U.S. multinationals in a more fundamental way. When a firm sells abroad, it generally sells its goods at a price denominated in the currency of the foreign country it is dealing in. Ultimately, the U.S. firm's shareholders care about dollar-denominated revenues and profits. A declining U.S. dollar means that a firm's euro-, pound-, or yen-denominated revenues can be exchanged for more U.S. dollars than they could have been when the U.S. dollar was stronger. Hence, a U.S. multinational that transacts in several currencies benefits when the dollar declines because its foreign revenues are worth more on a U.S. dollar basis, and vice versa. For example, in the mid- to late 1990s, many U.S. multinationals selling in Asia experienced phenomenal sales growth, yet their profits grew only modestly. During this period, the Asian currencies weakened, decreasing the worth of these firms' revenues in U.S. dollars. Hence, record-breaking unit sales translated into only modest profits in terms of U.S. dollars.

Discussion Questions

1. Who has a greater interest in a strong U.S. dollar—U.S. consumers or U.S. producers?

2. What sort of tax implications may exist for U.S. multinationals as a result of fluctuating exchange rates, especially a weaker U.S. dollar?

3. If a firm owes €100,000 to a German supplier due in 30 days (an account payable), does it prefer that the U.S. dollar strengthen or weaken relative to the euro?

4. Suppose a different firm is owed ₤88,000 from a UK customer due in 45 days (an account receivable). The spot exchange rate is $2.01/₤. How much (in U.S. dollars) would the firm receive if it were paid today? Discuss the gain or loss implications for the firm if the money isn't received for 45 days and the exchange rate moves to either $2.10/₤ or $1.90/₤ during that time.

Labels: , ,

Friday, October 05, 2007

The Dollar and the Drug Trade


The value of the U.S. dollar (USD) is falling against a number of foreign currencies, including the Canadian dollar (CAD), also known as the loonie. As the dollar weakens against the loonie, imports from Canada, including illegal drugs like marijuana, become more expensive. As American dope-smokers get priced out of the market for high-quality Canadian marijuana, they increasingly turn to lower-quality Mexican varieties and, as this Reuters article points out, Mexican growers become more willing to assume the risks of planting on American soil.

To see how the weakening dollar leads to change in the drug trade, consider the change in the CAD–USD exchange rate over the past year:

October 2006: 1.12 CAD per USD
October 2007: 1 CAD per USD

The value of the USD in October 2007 (1 CAD) is lower than it was in October 2006 (1.12 CAD). The exchange rate between the Mexican peso (MXN) and the U.S. dollar has changed a bit over the past year, but for simplicity, we'll assume it remained constant at 11 MXN per USD. Now that we've got some exchange rates, let's take a look at marijuana prices.

Let's assume that the prices of Canadian and Mexican marijuana remained roughly constant from October 2006 to October 2007. Suppose that 1 pound of top-quality Canadian marijuana sells for 3,500 CAD, while 1 pound of not-so-top-quality Mexican marijuana sells for 19,250 MXN. In October 2006, the price Americans paid for top-quality Canadian marijuana was:

3,500 CAD per pound x (1 USD / 1.12 CAD) = 3,125 USD per pound

Over the past year, the value of the USD declined against the CAD. The two currencies reached parity in September of 2007. As a result, the price Americans paid for Canadian marijuana increased to 3,500 USD by October of 2007 [3,500 CAD x (1 USD / 1 CAD) = 3,500 USD]. Given the roughly constant exchange rate between the peso and the U.S. dollar, the price Americans pay for lower-quality Mexican marijuana would remain the same:

19,250 MXN per pound x (1 USD / 11 MXN) = 1,750 USD per pound

The relative price of a good is the number of other goods that you can purchase for the same amount of money. Consider how the change in the exchange rate affects the relative price of top-quality Canadian marijuana. In October 2006, Americans could purchase approximately 1.8 pounds of lower-quality Mexican marijuana for the same price as 1 pound of higher-quality Canadian marijuana (3,125 USD per pound / 1,750 USD per pound). By October 2007, Americans could purchase 2 pounds of Mexican pot for the price of 1 pound of Canadian pot. As the value of the U.S. dollar declines against the loonie, the relative price of Canadian marijuana increases and the Mexican alternative becomes increasingly attractive.

Discussion Questions

1. What factors explain the decrease in the value of the U.S. dollar against the Canadian dollar? Why do you think the value of the dollar is not declining as quickly against the Mexican peso?

2. How does the oil boom in Western Canada impact the marijuana industry in British Columbia?

3. The Reuters article mentions the expansion of marijuana cultivation inside the U.S. by Mexican criminal groups. How does the rising price of Canadian pot contribute to the expansion of marijuana cultivation within the U.S.?

Labels: ,

Friday, September 21, 2007

Monetary Policy and Flexible Exchange Rates


The Federal Open Market Committee (FOMC), the monetary policy arm of the Federal Reserve, announced a 50-basis-point reduction in the target federal funds rate on Tuesday, September 18. The stock market soared in response to the rate cut because most market watchers were only expecting a 25-basis-point reduction. Read the FOMC statement for the reasons behind the rate cut. After the announcement, the U.S. dollar decreased in value against the euro, the British pound, the Japanese yen, and the Canadian dollar. This was no coincidence, and the reduction in the value of the dollar actually reinforces the Federal Reserve's goal of maintaining moderate economic growth.

The federal funds rate is a benchmark for other interest rates in the United States. For simplicity, let's imagine for a moment that the federal funds rate is the only interest rate in the United States. If this is true, then the U.S. interest rate is also the dollar rate of return for holding U.S. assets. However, the United States is not the only country in the world. The European Union has its own interest rate that represents the euro rate of return for holding EU assets. For a given amount of volatility in asset prices, investors place their savings in assets that offer the best rate of return after adjusting for the exchange rate.

A reduction in the U.S. interest rate makes U.S. financial assets relatively less attractive than before because the EU interest rate has remained unchanged. U.S. investors will want to purchase more EU assets (i.e., there will be an increase in the supply of U.S. dollars), and EU investors will want to purchase fewer U.S. assets (i.e., there will be a decrease in the demand for U.S. dollars). Figure 1 shows the subsequent changes in the market for U.S. dollars.

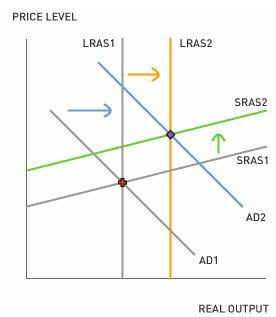
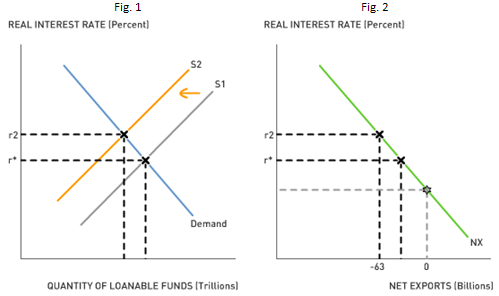
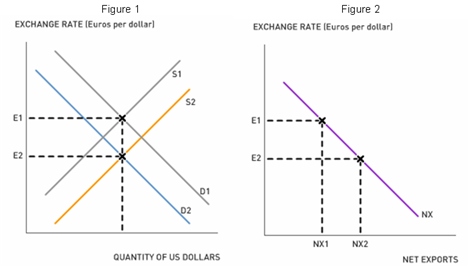
A depreciation of the U.S. currency will make U.S. exports relatively inexpensive for foreigners while making imports from foreign countries relatively expensive for Americans. A decrease in the interest rate causes an increase in net exports and reduces the size of the U.S. trade deficit. Figure 2 shows the relationship between the exchange rate and net exports. Since net exports are a component of total spending in the U.S. economy, the Fed's rate cut provides two boosts to aggregate spending: (1) the rate cut stimulates consumption and investment because the cost of borrowing decreases; and (2) the rate cut stimulates net exports due to U.S. dollar depreciation. By cutting the target fed funds rate, the Fed intends to prop up spending and growth at a time when tightening credit conditions threaten to slow or reverse the growth of economic output.

Discussion Questions

1. The previous analysis assumes that the United States and the European Union operate under a flexible exchange rate regime. Would the Fed be able to maintain moderate output growth after a severe shock, such as the subprime mortgage meltdown, if U.S. dollars were fixed to a currency such as the euro?

2. What if the Fed is wrong about the adverse effects of tightening credit conditions? What if growth would have continued at a moderate pace even without a rate cut? How would the decision to cut rates affect output and inflation in the short run and in the long run?

3. Suppose that at the next FOMC meeting on October 31, 2007, a jump in the inflation rate is reported. What would the FOMC do to the interest rate? How would this affect the exchange rate and net exports?

Labels: , ,

Monday, May 21, 2007

A Chinese Dilemma


The People's Bank of China announced on May 18 that it would allow the yuan to float within a 0.5% band around a government-imposed exchange rate. For example, if the government-imposed rate were 7.6938 yuan per U.S. dollar, the central bank would allow the exchange rate to fluctuate between 7.6553 and 7.7323 yuan per U.S. dollar. Due to a soaring economy and a widening trade surplus with the United States, the yuan closed at a record high of 7.6686 yuan per U.S. dollar on the first day of the new exchange rate policy. In other words, after the announcement, the yuan strengthened against the U.S. dollar.

A "stronger yuan" means that 1 yuan can purchase more U.S. dollars than before. If the exchange rate were 1 yuan per U.S. dollar, yuan holders could obtain $1 for each yuan exchanged. If the exchange rate fell to 0.5 yuan per U.S. dollar, yuan holders could obtain $2 for each yuan exchanged. Hence, the yuan gets stronger as its exchange rate falls, and is stronger at 7.6686 than at 7.7323 yuan per U.S. dollar.

The stronger yuan makes Chinese products more expensive for Americans, reducing net exports and therefore lowering China's real GDP growth rate. Why would the People's Bank of China want to destroy jobs in its exports sector by favoring a stronger yuan? One popular explanation is that the Chinese government is giving in to U.S. political pressure to strengthen the yuan. A stronger yuan would reduce the U.S. trade deficit with China, boosting American goodwill towards China and avoiding the passage of U.S. restrictions on Chinese imports.

There is also an economic explanation for China's new exchange rate policy. Along with China's recent double-digit economic growth comes the prospect of high inflation and economic instability. The standard monetary policy remedy for an overheating economy is higher interest rates. Raising the cost of borrowing reduces overzealous consumption and runaway investment spending. Furthermore, higher interest rates attract more foreign investors, raising foreign demand for Chinese currency, which strengthens the value of the yuan. At the same time, higher interest rates encourage Chinese investors to keep more of their yuan in Chinese assets, leading to a reduction in the supply of yuan, which adds additional upward pressure on the value of the yuan.

Therefore, the People's Bank of China faces an economic dilemma. If it wants to tame the roaring economy, it must allow the yuan to strengthen. But if it wants to maintain a fixed exchange rate, it would need to keep the interest rate unchanged. Today, the central bank has chosen economic stability over exchange rate stability.

Discussion Questions

1. The central bank coupled the exchange rate announcement with a Q&A document for the public. In what ways is the central bank's explanation for widening the exchange rate band similar to our analysis? In what ways is it different?

2. Why would the central bank hesitate to allow the yuan to float freely? In other words, what are the drawbacks of immediately eliminating exchange rate controls?

3. For some time, U.S. policymakers have complained about China's exchange rate policy. How would a weaker U.S. dollar affect American consumers of Chinese products? How would a weaker dollar affect American producers who compete with Chinese producers? How would a weaker dollar affect Chinese consumers of American products and American firms that export goods to China?

Labels: , , , ,

Thursday, March 01, 2007

Inflation Gone Wild


With an annual inflation rate of 1,600%, Zimbabwe currently holds the world title for fastest-increasing prices. As the late Milton Friedman put it, “Inflation is always and everywhere a monetary phenomenon. To control inflation, you need to control the money supply.” The inflation cure seems simple to understand from a textbook perspective: drastically cut back the money supply in order to lower the expected inflation rate.

Unfortunately, the cure might be worse than the disease. With the current unemployment rate at 80%, drastic cuts in the money supply could increase unemployment and cause a coup d'état before the expected inflation rate falls. The monetary contraction is inevitable if Zimbabwe wishes to tame the inflation monster, and the International Monetary Fund has urged the government to liberalize its exchange rate regime as a means to cushion the unemployment effects.

In order to understand the IMF’s position on Zimbabwe’s exchange rate, we must examine how maintaining an overvalued currency might contribute to soaring inflation, and how floating the currency might provide relief to both inflation and unemployment.

The graph on the left shows the market for Zimbabwean dollars. Assume that the government fixes the exchange rate at E1. A fixed exchange rate is the official value of the currency despite fluctuations in supply and demand. Initially, the official value equals the market value where D1 intersects S1 (point A). Then, due to unsustainable fiscal deficits and government land reforms that usurp private property, foreign investors flee Zimbabwe. Consequently, the demand for Zimbabwean dollars decreases from D1 to D2.

If Zimbabwe were under a floating exchange rate regime, the fall in demand for Zimbabwean dollars would result in the depreciation of the currency from E1 to E2 (point B). But because Zimbabwe’s government insists on a fixed exchange rate regime, the fall in demand for Zimbabwean dollars will cause a surplus of Zimbabwean dollars (Q1 - Q2). At point C, the currency is considered overvalued because the official value is greater than the market value. In order to eliminate downward pressures on the currency, Zimbabwe will instruct its central bank to buy the surplus of Zimbabwean dollars (and sell U.S. dollars), which will return the market to point A. Zimbabwe's central bank will eventually deplete its U.S. dollar reserves as the economy deteriorates from questionable domestic policies, and will borrow U.S. dollars in order to maintain the fixed exchange rate.

Since the loans are denominated in U.S. dollars, Zimbabwe must make periodic payments in U.S. dollars or face getting cut off from all sources of international capital. Due to disastrous domestic policies, the government has little tax revenue to make those periodic payments, and the only way to service their international debts is to print more money, just as Germany did after World War I. As the central bank expands the money supply to pay international debts, inflation increases, which places additional downward pressure on the Zimbabwean dollar: as foreigners demand less and less of the failing currency, Zimbabwe has to print more and more money, and sooner or later, everything will spin out of control.

One solution is to eliminate the fixed exchange rate regime altogether and allow the Zimbabwean dollar to float freely. If the currency were allowed to float today, its value would fall tremendously, which would stimulate exports and reduce imports. The graph on the right shows that as the exchange rate falls from E1 to E2, net exports increase from NX1 to NX2. A floating exchange rate would boost job creation as the central bank institutes the tough medicine of curing inflation by drastically reducing the money supply.

Discussion Questions

1. If the fixed exchange rate regime were eliminated, what would happen to the size of Zimbabwe's international debts in terms of Zimbabwean dollars? Would it increase or decrease?

2. The central bank has recently declared inflation illegal. How do price controls affect domestic markets like those for corn, wheat, electricity, and labor?

3. This analysis assumes that Zimbabwe's reduction in real GDP is due to domestic policies such as unsustainable fiscal deficits and poor private property rights. How might hyperinflation directly contribute to higher unemployment?

Labels: , , , , , ,

Tuesday, July 25, 2006

A Tale of Two Dragons: China's Trade Surplus and Inflation


In Chinese mythology, dragons can bring prosperity or destruction to villages and empires. China currently faces two dragons: the trade surplus that brings prosperity to Chinese manufacturers and urban workers, and inflation, which threatens China's price stability. Bloomberg reports that China's trade surplus might be fueling China's inflation problems.

One possible explanation is that the increase in the trade surplus outpaces the increase in potential output. Net exports are one component of aggregate demand in China. An increase in net exports pushes the aggregate demand curve to the right. Potential output increases as China utilizes more of its work-force (labor-intensive growth) and increases its capital stock (capital-intensive growth). The graph below shows that the increase in potential output (LRAS1 to LRAS2) is less than the increase in aggregate demand (AD1 to AD2). Whenever the increase in aggregate demand exceeds the increase in potential output, inflation is sure to follow (for example, from SRAS1 to SRAS2).
1. China maintains a relatively fixed nominal exchange rate between the yuan and the U.S. dollar (nominal exchange rate = 8 yuan per U.S. dollar). The real exchange rate is the nominal exchange rate times the ratio between the U.S. price level and the Chinese price level. The real exchange rate also represents the cost of U.S. goods and services relative to Chinese goods and services. How does an increase in China's inflation rate affect the real exchange rate?

2. How does an increase in China's inflation rate affect the trade balance between the United States and China?

3. The People's Bank of China often keeps its nominal interest rate equal to the United States' nominal interest rate in order to maintain the fixed nominal exchange rate (interest rate parity). Can the Bank of China choose to fight inflation and keep the nominal exchange rate fixed?

Labels: , , , , ,

Friday, June 16, 2006

An iTunes Index for Exchange Rates


This week, The Economist celebrated the 20th anniversary of its Big Mac Index. The newspaper regularly examines how current exchange rates compare to purchasing power parity (or PPP). The price of a standardized commodity that is otherwise locally produced, like Big Macs or Starbucks Lattes, is compared across countries. According to PPP, exchange rates should adjust so that a consumer's purchasing power is the same across countries. Big Mac prices can, therefore, give an indication as to where PPP exchange rates should be.

Of course, Big Mac prices build in the differences in local production costs between countries. For example, the price of beef is lower in Australia than in Japan, and Australian Big Mac prices reflect the lower input cost. Perhaps a standardized commodity that is free of variations in local costs would provide more accurate PPP exchange rate estimates.

Consider individual song downloads on iTunes. Like Big Macs, their pricing is set by a single firm--in this case, Apple. Unlike Big Macs, we can expect that there are no local variations in costs. Apple negotiates with the same music company (Sony, BMG, etc.) for the rights to digital provision of a given song. Hence, any cross-country differences in download prices likely arise from differences in demand.

There are many iTunes stores but only nine distinct local currency prices for iTunes downloads. The price of an iTunes download in the United States is US$0.99. The following table shows the price of downloading a song on iTunes in eight additional currencies. The second row shows the PPP exchange rate. This is simply the local price of an iTunes download divided by the American price (US$0.99). For example, iTunes prices suggest a PPP exchange rate of A$1.70 per US$1.00 between Australia and the United States (A$1.69 / US$0.99).

The third column shows the actual dollar exchange rate as of May 22. For example, the actual exchange rate between Australia and the United States was A$1.33 per U.S. dollar. The PPP exchange rate implied by iTunes prices suggests that the Australian dollar is overvalued--that is, it should take more than A$1.33 to purchase an American dollar (since it takes A$1.69 to buy an iTunes download worth only US$0.99 in the United States). The fourth column indicates whether a currency is over (+) or under (-) valued against the dollar according to the PPP exchange rate.

The final two columns show the local currency prices of Big Macs and the under or over valuation of each currency against the dollar when Big Mac prices are used to compute PPP exchange rates. The price of an American Big Mac on May 22 was $3.10.


There are two things interesting to note here. First, apart from Canada, iTunes songs are priced at a premium over the United States in all other music stores. Second, there doesn't appear to be a positive relationship between the PPP exchange rates implied by the iTunes and Big Mac indexes.

In theory, if Apple based its iTunes pricing optimally on long-term forecasts of exchange rates, then the iTunes Index should out-predict the Big Mac Index for exchange rate movements, as it is free of local variation. Only time will tell on that.

1. Apple appears to be practicing international price discrimination in its iTunes pricing. Usually, the richer the country, the higher the price. However, the United States has the highest GDP per capita but the second lowest prices. Can you think of any cost differences that might account for this? Can you think of reasons why the elasticity of demand for paid downloaded music is lower in Japan and Australia than in the United States? Do you think Apple is pricing optimally?

2. Big Mac pricing is probably more flexible than iTunes pricing. Apple may find it hard to change iTunes pricing once it announces a price point. What does this suggest about the relative merits of each as a predictor of PPP exchange rates? Does this suggest that iTunes may face some painful pricing realignment in the future?

3. Can you think of other commodities that might provide appropriate standards for predicting PPP exchange rates?

4. How do the other exchange rates compare using the Big Mac and iTunes instance? For example, calculate the Australia-Japan exchange rate and see how the relative prices for iTunes and Big Macs differ from these.

Joshua Gans is Professor of Management (Information Economics). The iTunes Index was first suggested by him earlier this year on his blog, economics.com.au.

Labels: , ,

Saving America


The U.S. trade deficit increased 2.4% between March and April 2006, which should be no surprise to our blog readers (archived entry: trade deficit and the negative saving rate). Some people point to China's fixed exchange rate or to the high oil prices for America's trade woes, but many macroeconomists contend that it is the lack of national saving that drives the trade deficit in the long run.

There are two markets that we have to consider when we examine the impact of saving on the trade deficit. First, consider the market for loanable funds, which determines the long-run real interest rate. Second, consider the relationship between the real interest rate and net exports. For simplicity, we're going to deal with absolute amounts (dollars) rather than relative amounts (percentages).

The market for loanable funds is where savers and lenders interact. Like any market, there's a supply and a demand. The demand for loanable funds consists of U.S. firms that want to borrow. The supply of loanable funds consists of U.S. firms, households, foreigners, and governments that want to lend. The price of loanable funds is the real interest rate, which is considered the "cost of borrowing" to borrowers and the "rate of return" to savers. The equilibrium real interest rate is where supply intersects demand, r*.

So what happens when the federal government increases its budget deficit and households decide to spend a larger share of their disposable income? An increase in the government budget deficit reduces public saving, and the increase in consumption reduces private saving. Put those two effects together, and we have a net decline in the supply of saving, which causes the equilibrium real interest rate to rise from r* to r2. (See Fig. 1.)A decrease in total saving in the United States pushes up the real interest rate. The real interest rate represents the rate of return for holding U.S. assets. If the real interest rate rises, then foreigners will want to buy more U.S. assets than they did before the rise. In order for foreigners to purchase U.S. assets, they must purchase U.S. dollars. Consequently, the demand for dollars increases, which increases the price of U.S. dollars. An appreciation of the U.S. currency, in real terms, will make U.S. exports less competitive and imports from foreign countries more attractive. An increase in the real interest rate causes a decrease in net exports and worsens the U.S. trade deficit. (See Fig. 2.)

Discussion Questions

1. According to our analysis, a fall in total saving actually increased the U.S. consumer's purchasing power of foreign goods and services (more U.S. imports) while it decreased the foreign consumer's purchasing power of U.S. goods and services (fewer U.S. exports). Is this an economic disaster or a sign that Americans are relatively wealthier than most people in the world?

2. A decrease in total saving increases the real interest rate, and a higher real interest rate increases foreign demand for U.S. assets, causing the price of the dollar--the real exchange rate--to rise. China purchases many U.S. assets in order to keep the value of its currency, the renminbi, relatively cheap compared to the dollar. In doing so, China intends to sustain American demand for Chinese-made goods. How does China's fixed nominal exchange rate policy affect the U.S. trade deficit in the long run?

3. If permanently higher oil prices reduce U.S. potential output, how does this affect national saving in the long run? How does this affect the trade deficit in the long run?

Labels: , , ,