Friday, March 26, 2010

The Opportunity Costs of Relationships


Since it is generally easy to compare the price-tag cost of one good or service against another, people tend to consider only the monetary cost of a decision. However, what’s also important to consider is the whole value of what you are giving up when you make a decision. In economics, this is known as the opportunity cost. A simple textbook example describes a market that offers two goods for sale: apples and oranges. If an apple can be bought for $1 and an orange for $0.50, the monetary cost of buying an apple is $1, but the opportunity cost is equal to how much you value the two oranges that you give up if you choose to buy an apple. While this observation may not seem particularly important in this context, it can be applied far beyond the realm of monetary dealings.

Romantic relationships are obviously not regular commodities like apples and oranges in that you don’t just head to your local date market and buy a girlfriend or boyfriend. Despite this violation of the competitive hypothesis, relationships have opportunity costs too. That is, the opportunity cost of a relationship is comprised of all the things one foregoes to be in that relationship. While it is not difficult to see the many wonderful things you gain from having a romantic partner, it is easy to overlook the things you give up in exchange.

Here’s a list of some of the things that most people forgo to some degree to be in a relationship:

(1) Spending time with friends and family
(2) Going out and meeting new people
(3) Developing or engaging in hobbies
(4) Working
(5) Exercising

Some people may find that being in a relationship allows them to do more of some of these things (maybe you work out together or spend lots of time with mutual friends), but usually the time you spend with your significant other tends to edge out at least some of the things you like to do on your own.

In economics we represent such trade-offs using graphs like the one below. The red line is known as the budget constraint, and while it typically represents a monetary budget, in this case it represents a sort of time budget for an individual in a relationship with eight hours of leisure time per day (assuming eight hours of sleep and eight hours of work). The eight hours of leisure can be divided anywhere between spending all 8 hours with your significant other or all 8 hours doing other things. Regardless of what allocation a person chooses on the red line, any movement along the line represents a tradeoff of one activity for another.

Despite the perception of economics as dismal science, the point is not that the cost of relationships outweighs the benefits, but rather that there is an opportunity cost to everything. So if you’re single and accustomed to thinking about all the things you’re missing out on, take comfort in the things that you aren't giving up.


Discussion Questions:

1. Consider the graph depicting the time-budget constraint. If a person quits their job and suddenly has more time, how does this affect the person’s position on the line or the position of the line itself?

2. If person A and person B primarily give up time spent with friends when they are in relationships, and person B really likes being with friends, which person’s relationship comes at a higher opportunity cost? If you were to draw each of their indifference curves on the budget constraint graph, how would the two compare?

3. How would being in a relationship affect your overall consumption? If you are in a relationship, are there some goods or services that you would consume more or less of in a given week? Which of these goods would you say are “complementary goods” with relationships? Which are “substitutes?”

4. Sometimes when economists model consumption choices for goods that are consumed over longer periods of time, they introduce switching costs. What sorts of things associated with a break-up may be considered a switching cost? If you assume that breakups are costly, how might this change a person’s decision to allocate their time?

Labels: , ,

Friday, February 12, 2010

Econolympics


As a recurring Winter Olympics viewer, I am counting down the days until the games begin on February 12. As an economist, however, I am intrigued by the number of tools an introductory economics course provides students with to analyze the effects of the Olympic games on the local economy of Vancouver. Three topics in particular come to mind that most students will encounter in a basic economics course: consumer spending, negative externalities, and cost-benefit analysis.

A recent article reports that the winter games are expected to boost travel-related spending by $800 million in Vancouver thanks to the incoming surge of general spectators, friends and families of competing Olympians, and athletes themselves to the metro area. But where does this spending go? Hotels, restaurants, and transportation are the likely candidates to benefit from such a surge, so the leisure and tourism industry should receive the largest boost. Although this positive shock to the industry is temporary, Olympics-related spending in 2010 is expected to account for 0.8% of Vancouver’s economic growth, trailing only housing investment and government spending.

However, accompanying this boost in tourism are some negative externalities on locals. While you may not always need a reservation to your favorite restaurant on a normal weeknight, the increase in the number of visitors to the metro area is likely to cause long lines for restaurant-goers. Even getting to your favorite watering hole might be no small feat, as traffic congestion and parking dilemmas are likely to pick up due to the additional vehicles on the road at any given time. Finally, increased pollution and trash creation are also likely to impose a negative externality on residents during the winter games.

Setting up shop for the winter games comes at a high price. Holding the Olympics requires that the host city build the necessary facilities, hire additional security, and provide extra health care in the case of injury to athletes or spectators. This is likely to weigh on the spending budget for Vancouver’s economy. Therefore, standard cost-benefit analysis would require you to determine whether the benefits gained from having the Olympics in a particular city outweigh the costs.

In short, there is a plethora of economic topics you could use as a conversation starter regarding the Olympics. So pick your favorite concept, and analyze away!

Discussion Questions:

1. How would you value having the Olympics in your hometown? Would the benefits you receive from this outweigh the negative externalities imposed on you by the winter games?

2. How do you think the Olympics will affect things like hotel and menu prices during the winter games? Do you expect such a short surge in demand to affect other local pricing? Why or why not?

3. State how the following introductory economic concepts could be used to analyze the effect of the Olympics on Vancouver: the multiplier effect, the Tragedy of the Commons, and demand shocks.

Labels: , , , ,

Wednesday, April 15, 2009

The Price Is Wrong, Bob!


With significant contributions and analysis from Ben Resnick

The Price Is Right, one of America’s favorite game shows, can be used to illustrate numerous economic concepts, including optimal bidding strategies, risk preference, and search theory. Twice an episode, one of the most purely mathematical portions of the show occurs, when contestants take their turn to spin "the big wheel." In addition to being a crucial prelude to the Showcase Showdown, it is a convenient hands-on application of using probability theory to derive an optimal decision-making rule. The wheel contains 20 equally sized panels corresponding to values between $0.05 and $1.00. Three contestants reach the wheel during each half of the show. The winning contestant is the one whose total score comes closest to a dollar without going over; as a prize, they earn one of the two spots in the show’s final round, the Showcase Showdown. One at a time, each contestant spins the wheel to get an initial value. The player then has the option to keep his current value or spin one more time. If he spins again, his final score is the sum of his two spins. Any contestant that goes over $1.00 automatically loses. In the event that two or three contestants are tied with the same final value, they each spin the wheel once, highest score winning.

Consider three contestants: Mr. 1 will spin first, Ms. 2 will spin second, and Mrs. 3 will spin last. Assuming that all of the contestants aim to maximize their chances of winning a spot in the Showcase Showdown, we set out to derive the optimal strategy for Mr. 1. In order to determine his optimal strategy, we will make three simplifying assumptions. First, each result from spinning the wheel is an independently determined random outcome, where each panel is equally likely to be spun. Next, in the event of ties, each tied player has an equal chance of winning (either 50% for a two-person tie or 33% for a three-person tie). Finally, the show pays a $1,000 bonus prize (and a chance to earn even more money on a “bonus spin”) to any contestant scoring exactly $1.00 on one spin or a combination of two spins. However, we will not consider these cash prizes as an extra incentive to spin again since they have no bearing on which contestant goes to the Showcase Showdown. We focus only on the decision-making rule that gives Mr. 1 the best chance to make the final round.

The only decision a player makes during the game is whether to spin again or stop after the first. Clearly this decision will depend on the value of the first spin—the higher the first spin, the more reasonable it is to stop. To explain fully how a player maximizes his chance of reaching the Showcase Showdown, we solved for a cutoff value: the lowest initial spin value where Mr. 1 has a higher probability of winning by staying rather than spinning again. In order to find the optimal stopping value for Mr. 1, we first calculated the probability that Mr. 1 wins the game (either outright or through the tie-breaker) if he stays with any initial spin. This gives 20 different probabilities of winning the game if Mr. 1 stays, one for each possible spin value. For example, if Mr. 1 stops with $0.55, he stands a 7.4% chance of winning whereas if he stops with $1.00, he has an 86.2% of going to the Showcase Showdown. Next, we calculated the odds that Mr. 1 wins if he spins again. To do this, we looked at his likelihood of winning for each possible score after his second spin is added to his first. Mr. 1’s optimal cutoff in this game is $0.70, where stopping with a spin of $0.70 gives a 19.8% chance of winning, but spinning again gives only a 15.8% chance of winning. At any initial spin less than $0.70, Mr. 1 has a better chance of winning by spinning again. For example, after a first spin of $0.65, Mr. 1 has a 14.6% chance of winning if he stops and a 16.8% chance of winning by spinning again. By a similar method, we find that in the case where Mr. 1 goes over $1.00, the stopping rule that maximizes Ms. 2’s chances of winning is to stop with any initial spin of $0.55 or more.

Discussion Questions

1. How would you expect the stopping values to change if a fourth player were added to this game? What would the effect on the stopping values be if we factor in the bonus prize for a total score of exactly $1.00?

2. Given that the stopping values decrease as fewer players remain in the game, do you expect a player with a certain spot in the order to have an advantage? If so, which one?

3. Deal or No Deal is an example of another game show where a contestant’s optimal strategy could be described by a stopping rule. Can you think of other games where this type of strategy can be applied?

Labels: , ,

Tuesday, April 14, 2009

ARRGGHH... The Stakes Be High, Says I!


When you pay ransom to a hostage-taking pirate, traditional economic theory suggests that you increase the returns to piracy, encouraging more of it. If you kill a hostage-taking pirate, you increase the cost of piracy, which should discourage would-be pirates from taking to the seas.

The response by the Somali pirates to the U.S. Navy's recent killing of three pirates has been just the opposite though. These gangs say they are now devoted to revenge-taking over more ships and taking more hostages than ever. The cost of doing business has risen, and yet they want to do more of this business than ever. Why do you think this is?

Discussion Questions

1. In order to quickly obtain large ransoms, pirates must signal a credible threat to cargo ship owners. How might this credibility issue play into the pirates' response to the actions of the U.S. government?

2. The pirates killed by U.S. Navy snipers were holding an American captain of an American boat with an American crew. Might governments respond differently in situations involving multi-national crews?

3. The pirates who were killed were likely just henchmen with little power in the criminal organization. Did the "cost of doing business" really rise very much for the pirates running the organization?

4. In what ways does the government provision of naval security in international waters resemble a public good? Might the current allocation of security (both private and public) in international waters be inefficiently low?

5. From the standpoint of ransom maximization for a small individual gang of pirates, what is the optimal amount of piracy? What is the ransom maximizing strategy if the piracy off the Somali coast is coordinated by a cartel of gang lords?

Labels: , , , , , ,

Thursday, July 17, 2008

California's Foil Balloon Problem


A helium-modified voice is good for a laugh, but the joke is risky. Inhale too much helium from the balloon and you'll pass out. It turns out that helium balloons can black out more than just the overzealous prankster. As recent news stories point out, foil helium balloons can get caught up in power lines and cause outages. California utilities reported hundreds of balloon-related outages last year: 211 for northern California's PG&E and 478 for southern California's Edison. California Senate Bill 1499 proposes to deal with the problem by banning foil balloons and fining violators. Though foil balloons can be a problem, a bit of economic analysis suggests that the heavy-handed ban may not be the best remedy.

By increasing the odds of costly power outages, helium balloon consumption imposes external costs on society. The vast majority of electricity consumers outside of the helium balloon market may nonetheless end up incurring some costs when errant balloons make their way into nearby power lines. Since helium balloon consumption imposes external costs, the social benefit of helium balloon consumption is considerably less than the private benefit. When the social value of a good is lower than the private value, there will be an inefficiently high level of consumption in the private market.

So rather than banning the balloons altogether, the California legislature may want to consider a corrective tax. Taxing the consumption of helium balloons would force buyers to internalize the heretofore external costs that the balloons impose on everyone else. The tax would reduce both foil balloons purchased and balloon-related power outages while giving buyers and sellers an incentive to shift toward less disruptive party favors.

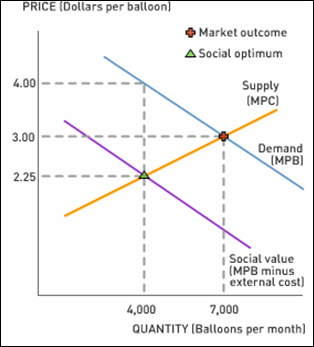
To analyze the issue more closely, we need to define some costs and benefits in the market for foil balloons. Because helium balloon consumption generates external costs, the marginal social benefit from a helium balloon will be less than the marginal private benefit:

Marginal Social Benefit (MSB) = Marginal Private Benefit (MPB) – External Cost

In the foil balloon market, the supply curve represents the marginal private cost (MPC) of selling balloons and the demand curve represents the marginal private benefit (MPB) of consuming balloons. The marginal social benefit (MSB) curve lies below the demand curve, since the social value of foil balloons incorporates the external costs. The socially optimal output level occurs where the marginal private cost of producing the balloons is equal to the marginal social benefit of consuming them—well below the market outcome at the intersection of our standard supply and demand curves. At points above the socially optimal output level, the marginal social benefit of the balloons will be less than the marginal cost of producing them. As a result, at least some of the current balloon consumption is inefficient.


Discussion Questions

1. According to our diagram of the hypothetical helium balloon market, what is the size of the tax necessary to achieve the socially optimal output level? Can you think of other markets where corrective taxes have been used or might be used to curb the external costs of consumption or production?

2. Is a ban more costly than a corrective tax in this case? Not all helium balloon buyers are careless with their purchase. Is the tax fair?

3. While a corrective tax has the potential to move a market closer to its social optimum, the use of government revenue from such taxes may be socially inefficient and wasteful. The correction of a market failure may simply beget government failure. Can you think of ways to prevent the government from wasting corrective tax revenues?

4. How would you go about estimating the external costs of helium balloon consumption?

5. What can you say about the price elasticity of the demand for and supply of helium balloons? Many party supply stores claim that any disruption to helium balloon sales will threaten jobs. What do you make of this?

Labels: , , ,

Monday, July 07, 2008

Oil Prices and Expectations


Harvard economist Martin Feldstein's latest opinion piece in the Wall Street Journal argues that we can implement policies today that will impact the current price of oil. Current oil production responds to expectations about the future, Feldstein explains. Any significant change in expectations about the future price of oil will have an immediate impact on the current supply of oil. Broadly speaking, the expected price of oil changes for one of two reasons:

1. Changes in expectations about the growth of oil demand; and
2. Changes in expectations about the growth of oil supply.


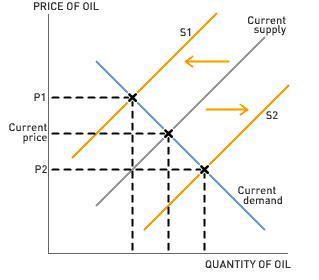
How might changes in expected oil demand lead to higher current prices? As Feldstein points out, "when oil producers concluded that the demand for oil in China and some other countries will grow more rapidly in future years than they had previously expected, they inferred that the future price of oil would be higher than they had previously believed." If oil producers expect higher future prices for oil, they will curb production today (leave some oil in the ground) in hopes of extracting it at higher prices in the future. On the graph, the current supply of oil shifts to the left, to S1, causing the current price of oil to rise to P1 and the current quantity of oil to decline.

How might changes in expected oil supply lead to higher current prices? Again, from the editorial: "[C]redible reports about the future decline of oil production in Russia and in Mexico implied a higher future global price of oil." If producers expect oil supply growth to weaken in the future, the expected future price of oil rises, and oil producers leave some oil in the ground today in order to extract it at higher future prices. Once again, we'd expect the supply curve for oil to shift to the left, causing the price of oil to rise (to P1) and the quantity of oil to decline.

An increase in expected oil supply or a decrease in expected oil demand would lead to lower current oil prices. If oil producers think that future cars will be much more fuel-efficient than previously believed, they'd expect relatively weak growth in oil demand, and correspondingly lower future prices. In this case, producers respond by pumping more oil today in an effort to avoid lower future prices. Similarly, as Feldstein points out, "increasing the expected future supply of oil would also reduce today's price."

Discussion Questions

1. Although Feldstein points out that a significant increase in expectations about the future supply of oil would put downward pressure on today's price of oil, he does not explicitly endorse a policy of drilling in currently protected areas of the United States. The crucial question is whether or not future drilling in currently protected areas would have a large enough impact on worldwide oil supply to trigger production changes today. What do you think?

2. There's much discussion in the news about how to develop alternative sources of energy that would reduce the future demand for oil. What are some policies that would reduce the future demand for oil and oil-derived products, like gasoline? Would government commitment to these types of policies be credible enough to lower expectations of future oil prices?

3. Not all economists agree with Feldstein about the ability of current energy policies to impact current oil prices. Many (though not necessarily most) believe that there is very little the government can do to achieve lower oil prices in the next few months or years. Why might this be the case?

Labels: , , ,

Tuesday, June 10, 2008

China’s One-Child Rule, Post-Earthquake


Right on the heels of Cyclone Nargis in Myanmar came news of another equally shocking and destructive natural disaster in China. The very first reports of the devastating earthquake centered on the destruction of schools and the resulting loss of many young lives. The quake left many families without children—particularly because China enacted a policy in 1979 that restricts families to having just one child in an attempt to help ease the pressures of a fast-growing population. The Chinese government is now ensuring that families who had a child killed or disabled by the earthquake understand that they are allowed to have one more child, as reported here.

Why was China’s birthrate so high before this policy was implemented? Japan has no one-child policy, yet its birthrate is relatively low. What is the difference between these two countries in this regard?

In a developing country (as China arguably still is to an extent), markets for retirement savings and pension funds are often absent. To compensate for this, parents must count on their children for support later in life. And a couple must decide how many children they need to have in order to be reasonably certain they will be supported. This is determined in part by the couple’s attitude towards risk, and when it comes to security in old age, it is reasonable to assume that most people will be quite risk averse. To assess the risk of ending up alone and destitute in their old age, they need to estimate the probability, given current economic and social factors, that any single child will provide old-age support. Assuming the child lives into adulthood, he or she must earn enough income to be able to provide support, as well as being willing to do so. Furthermore, if only men have the earning potential needed to provide financial assistance, the necessary number of children will double. Facing these risks, couples in developing economies often choose to have larger families than needed for the sake of old-age security, leading to relatively high birthrates. China’s one-child policy was meant to curb this trend.

Discussion Questions

1. The opportunity cost of raising children is another factor that influences birthrates. Women in China (particularly rural China) face fewer employment opportunities, and at lower wages, than women in Japan. How does this help to explain the disparity in desired number of children between the two countries?

2. Will a grown child be able to support two elderly parents any better than a single parent could provide for him- or herself and two young children? How might this problem be magnified further with multiple generations of only children?

3. Has China’s one-child policy been a success? Why or why not? What unintended consequences might result from this policy?

Labels: , , ,

Wednesday, May 21, 2008

The Hanger Hang-Up


According to a recent NPR story, dry-cleaning costs increased substantially after the U.S. imposed import tariffs on wire hangers from China—so much so that many dry cleaners are now soliciting customers for unused hangers. The U.S. imposed the tariffs after several American producers made dumping accusations against Chinese producers. Dumping occurs if a Chinese firm sells hangers in the U.S. for significantly less than it sells the same hangers for in China, or for significantly less than it costs to produce the hangers in China. The U.S. International Trade Commission found that Chinese manufacturers were, in fact, dumping hangers in the U.S. market.

Economists tend to be skeptical of trade restrictions based on the anti-dumping argument. In markets for standardized goods (like wire hangers) with relatively free entry and exit, there's no long-term benefit from selling a product at below cost. While legitimate cases of dumping certainly come up, some cases may simply involve domestic firms that want to protect their market position from lower-cost foreign manufacturers. In the case of hangers, the tariffs benefit U.S. manufacturers at the cost of the dry cleaners and consumers who would otherwise benefit from lower-priced Chinese imports.

Milton Magnus III, owner of one of the U.S. manufacturers that filed for the anti-dumping duties, argues that the costs to consumers are negligible—amounting to a penny or two per hanger. "If I pay $12.95 to have my suit cleaned and that hanger cost him a cent and a half more, that's $12.96 and a half. It's not a factor." Magnus's point partly explains why import-competing industries often succeed in their efforts to lobby government for the imposition of trade restrictions: the tariff offers concentrated benefits to a few domestic firms, while the costs of the tariff are spread out among millions of consumers—none of whom see a sharp increase in price. Of course, over millions of hangers, a penny or two per hanger can add up.

Advocates of trade restrictions often argue that protection will save jobs. Since we can observe price and cost increases associated with trade restrictions, we can estimate how much it costs to save each job in a protected industry. According to the NPR story, there are roughly 30,000 dry cleaners in the U.S., and on average, each pays an additional $4,000 per year due to the hanger tariff. This indicates an average annual cost of 30,000 firms x $4,000 per firm = $120 million. According to the U.S. International Trade Commission's report, U.S. employment in wire hanger manufacturing was 564 workers in 2004 and fell to 236 workers by 2006. Let's assume that employment in this sector would have fallen to zero in the absence of the tariff, and that with the tariff, employment will recover to 2004 levels. In other words, assume the tariff "saves" 564 jobs. Dividing the cost of the tariff to U.S. dry cleaners ($120 million year) by the number of jobs saved (564 jobs) indicates that each job saved costs about $212,765 per year. Keep in mind that the typical full-time worker in this sector earns about $30,000 per year. Even if we assume that industry employment doubles, the cost of the tariff is still roughly $120,000 per job.

Discussion Questions

1. Our cost estimates ignore possible job losses in the dry-cleaning industry. How would this impact the overall cost of the trade restrictions? Will dry cleaners organize to oppose the tariff on wire hangers from China?

2. According to the Trade Commission report, China provides tax rebates to firms that export items that use steel (such as wire hangers). As of July 2007, the tax rebate amounted to 5% of the value of exports. How do you think export subsidies or tax rebates should factor into government analysis of trade policies?

3. The story mentions dry cleaners' attempts to reclaim and reuse wire hangers. Are there inadvertent environmental benefits from the tariff? Could the U.S. government encourage dry cleaners and their customers to reuse wire hangers without resorting to tariffs on Chinese manufacturers?

Labels: , ,

Wednesday, November 07, 2007

Tricky Truths in the Health Care Debate


Economist Greg Mankiw recently took aim at three misunderstood truths in the health care debate. Consider the truths:

1. Canada, a country with national health insurance, has a longer life expectancy and a lower infant mortality rate (measured in deaths per 1,000 births) than the United States.

2. Forty-seven million Americans lack health insurance.

3. Health care costs account for an ever-growing share of American incomes.

Whether the U.S. health care system should look more like Canada's is a big open question. Mankiw asks us to look at these three truths more closely to see how much clarity they actually add to our national debate on health care. Read his column to learn more.

Discussion Questions

1. According to the column, how do the incidences of accidents, homicide, and obesity in the United States help to explain the differing life expectancies in Canada and the U.S.? How would changing the U.S. health care system address the incidence of accidents, homicides, and obesity in America? Can you think of alternative policies that might close the life expectancy gap by reducing the incidence of accidents, homicide, or obesity?

2. According to Mankiw, the prevalence of low-birth-weight babies in the U.S. contributes to its relatively high infant mortality rate (infant mortality is universally higher among low-birth-weight babies than it is among babies born at normal weights). What factors explain the higher rates of low-weight births in the United States? Will an overhaul of the U.S. health care system address the number of low-weight births in the U.S.? What alternative policies might reduce the number of low-weight births in America?

3. Approximately 47 million Americans (of about 300 million total) lack health insurance. For what reasons does Mankiw argue that this number significantly overstates the problem of the uninsured in the United States? How do uninsured people receive care under the existing health care system? What policies might provide insurance to the group of American citizens who simply cannot access health insurance? How would national health insurance change the pool of the uninsured and the cost of treating them?

4. Why do we spend a larger share of our incomes on health care than previous generations? Clearly, health care is a normal good (increases in income lead to increases in the quantity of health care we demand). But is it also a luxury good (increases in income lead to relatively large increases in quantity demanded)? Is the growing share of income that we devote to health care a bad thing? In what way are increasing health care costs associated with increasing health care benefits? Read this David Leonhardt column for more on this topic.

5. Hopefully, a closer look at the three truths above will help to clarify the debate over health insurance in the United States. That said, understanding how a change to our health insurance system can or cannot influence these outcomes doesn't point to a specific policy prescription. What do you think?

Labels: , ,

Tuesday, October 09, 2007

O.K. Consumer: Pick Your Price


I love Radiohead. Really, love. I still remember sitting in my car in the record store parking lot with one of my best friends, listening to their fourth record, Kid A, all the way through—in awe. That record took Radiohead, and rock music in general, in an unexpected direction. And true to form, Radiohead is again doing things a little differently with their latest effort, In Rainbows, releasing October 10. But this time, the surprise isn't the music itself—it's how they plan to deliver that music to the world.

Recently freed from their ties with the record label EMI, Radiohead has decided to release their latest album in two ways: as a disc-box containing the CD, vinyl, and various Radiohead goodies—available for ₤40 (about $81)—or as a download. The interesting aspect of the download option is that you can pick your own price. $0? Fine. $80? Fine. You pay whatever you want.

To find out more, check out Shane Richmond's recent column, "How Radiohead killed the record labels," and this NPR interview with Tyler Cowen of George Mason University.

Discussion Questions

1. Why would Radiohead put itself out there like this? If past releases are any indication, there are certainly millions of consumers willing to pay normal price for a new Radiohead album. But will they pay, given the choice? Like me, some fans will pay willingly, deriving some degree of benefit from knowing that they're compensating a great band for its creative efforts. You know that feeling you get after you've given a good tip? That good feeling usually comes from visible tipping—that is, the recipient knows who you are. Paying for the download, by contrast, is anonymous. How might this affect what people actually pay?

2. I certainly wouldn’t be blogging about this album if it were $9.99 on iTunes. Even as non-fans read about this, they may be curious enough to check out the Radiohead site. They may even listen to a song or two. Maybe they'll like it enough to cough up some money for the download, or maybe they'll buy the disc-box, or a concert ticket, or a T-shirt. What is Radiohead’s marginal cost of offering one more digital download for sale; what is the marginal benefit to the band of having additional listeners? Might a broader fan base generate enough revenue to more than make up for the revenue the band forgoes by not selling downloads at a standardized price?

3. A firm engages in perfect price discrimination when it charges each consumer a price equal to his or her individual willingness to pay. How is this effort similar to price discrimination? How is it different?

4. How much will you pay? You would maximize your consumer surplus by paying nothing. But can you stomach it? Does a self-selected price of $0 bring along with it an intolerably high price in guilt? Along these lines, how will the prices paid by the dedicated fan differ from those paid by the casual observer?

Labels: , ,

Friday, May 04, 2007

Who Wants to Be a Harvard Grad?


It's getting tougher and tougher to get into Harvard. The admissions rate—that is, the fraction of applicants who are accepted—has been declining for decades. And you don't need an 800 on your math SATs to figure out why: the number of spots at Harvard has remained roughly the same, while the number of applicants has soared. But why has the number of applicants soared? And should it be soaring?

As with all economic questions, the answer comes down to costs and benefits. The social and economic benefits of attending Harvard are large. To spend four years among the "best of the best" (by some measures, anyway) is an exhilarating experience. And in what Robert Frank calls our "winner-take-all society," going to an elite school may be a necessary first step if you want to compete for the kind of positions (Supreme Court justice, CEO, Nobel Prize winner) that only a microscopic proportion of the human population ever obtain. But these benefits are roughly the same as they have always been: indeed, students can now choose from many more excellent colleges than they could in the past.

In the meantime, what has happened to the cost of getting into Harvard? Harvard alum Michael Winerip recently wrote an essay in the New York Times on how the young people applying to his alma mater now are, on paper at least, much more accomplished than he was at their age. But many of their accomplishments—from a string of 5's on AP tests to touring Europe with youth orchestras—are the result not of increased inner drive among college-bound students, but rather of a nascent industry designed to help students get into college. Winerip writes that, as an alumni interviewer, he interviewed a girl who worked at NASA doing research on weightlessness in mice; his project in high school, by contrast, was a shoebox with soil and bean sprouts. And while some of the students he has interviewed take 10 AP courses and get top scores on all of them, he took a single AP course and scored a 3. However, he writes,
Of course, evolution is not the same as progress. These kids have an AP history textbook that has been specially created to match the content of the AP test, as well as review books and tutors for those tests. We had no AP textbook; many of our readings came from primary documents, and there was no Princeton Review then. I was never tutored in anything and walked into the SATs without having seen a sample SAT question.

As for my bean sprouts project, as bad it was, I did it alone. I interview kids who describe how their schools provide a statistician to analyze their science project data.
Reading Winerip's essay, it may seem as though the costs of getting into Harvard have skyrocketed—but in fact, if one thinks about this like an economist, it quickly becomes clear that the opposite is true. The price of preparing any one element of one's résumé has in fact decreased: for example, one can now buy a textbook that is keyed to the AP test, whereas before, students didn't have access to those resources.

However, total expenditure on college preparatory activities has increased dramatically. This is because, as the law of demand would predict, the lowered cost of achieving specific goals leads to more people attaining those goals—and therefore drives up the number of people applying to Harvard. Furthermore, as more people do the things that used to get you into Harvard, students have to do more and more to set themselves apart from the rest of the crowd.

Discussion Questions

1. Winerip laments the fact that many of these driven students are missing out on the fun of childhood. Is it efficient (in the economic sense of the word) for so much effort to be devoted to getting into college? What are the costs and benefits of this kind of competition?

2. Use a supply-and-demand model to illustrate what has happened in the market for college preparatory activities (tutoring, mentoring, test prep). Note that the probability of getting into Harvard is both dependent on the outcome of that market and a determinant of demand in that market. How is an equilibrium reached that takes both of those factors into consideration?

3. What effect does increased competition for elite schools have on other schools? Is it easier or harder to get into a good state school because of all the competition to get into Harvard? What about the effect on tuition, both at elite schools and other schools?

Labels: , , ,

Tuesday, December 05, 2006

PlayStation 3 and Arbitrage


Two weeks ago, thousands stood in line to be among the first to get their hands on the PlayStation 3. Surprisingly, many of these people who waited through the cold, rain, and snow did not actually want to keep the PS3. They wanted to buy it for $600 and sell it on eBay for twice the price--a profit-seeking behavior known as arbitrage.

Economists define arbitrage as the act of profiting without bearing any risk. A large shortage is the best indicator of an arbitrage opportunity. A shortage occurs when quantity demanded exceeds quantity supplied--in other words, when the number of PS3's that consumers are willing and able to buy at the current retail price exceeds the number of PS3's available in stores. A shortage implies that there are consumers willing to pay more than $600 for a PS3 who were unable to purchase one because they were too busy to stand in line or too far back in the line. Arbitrage is a means to allocate the PS3's from the initial buyers to the people who want them even more than the original buyers.

Discussion Questions

1. Sony should have forecasted the shortages and price bids on eBay for the PS3 because they sold out of other popular consoles when they were first released (PlayStation, PS2, and PSP). Would it be profitable for Sony to eliminate the "frenzy shortages" by pricing high during the first months and lowering prices afterwards? For example, they could charge $1,000 for the PS3 in November and December, but lower it to $600 afterwards.

2. Sony reports that it costs more than $600 to produce a PS3. Why would it be profitable for Sony to sell the PS3 at an initial loss?

3. Why would a gamer prefer to pay $1,200 for a PS3 on eBay rather than standing in line to buy one for $600?

Labels: , , ,

Thursday, October 05, 2006

Cheap Gas Hurts


Economists rarely advocate higher taxes on a good or service because higher taxes often increase the price that consumers pay and lower the price that producers receive--a "lose-lose" situation for both consumers and producers. However, Pigovian taxes, which are used to correct situations in which the free market produces an inefficient result, might actually increase social welfare. Greg Mankiw, an economist at Harvard and founder of the Pigou Club, argues that such taxes are currently needed on gasoline, due to the negative externalities that accompany gasoline consumption.

A negative externality is a cost imposed on a third-party by the consumers and the producers of a good or service. Take for example, gasoline. Oil companies produce and distribute large amounts of gasoline to satisfy America's desire to drive. How does a person who uses gasoline hurt other people? First, burning gasoline emits toxic chemicals such as carbon monoxide and carcinogens that damage public health. Second, cheap gas contributes to excessive driving which wears down our country's highways and causes traffic congestion. Third, as Al Gore argues, burning gasoline produces carbon dioxide, which contributes to global warming. Fourth, as Thomas L. Friedman has argued, high oil revenues actually support regimes like Iran and Venezuela, decreasing freedom in those countries as well as our own national security.

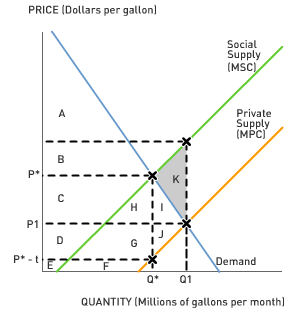
If the consumption of gasoline imposes a negative externality, then economists say that the marginal social cost (MSC) of gasoline exceeds the marginal private cost (MPC). The invisible hand fails to bring the market to an optimal outcome because the free market equates demand and private supply, and does not take external costs into account. Ideally, the market would equate demand and social supply, but rational consumers would not take into account external costs because they feel someone else should reduce their consumption of gasoline (free-rider problem). The free market leads to an almost shocking result: the price of gasoline (P1) is below the socially-optimal price (P2), and the quantity of gasoline consumed (Q1) exceeds the socially-optimal quantity (Q2).

In other words, in a free market, Americans consume too much gas! The government may remedy the situation by increasing the per-unit tax on gasoline. Higher gas taxes would increase marginal private cost and reduce the gap between social supply and private supply.

1. In a free market, the price of gas is P1 and the quantity of gas consumed is Q1. In this case, what is consumer surplus plus producer surplus minus total external costs?

2. Suppose the government imposes a per-unit tax on gasoline that forces the market to price and produce the socially-optimal quantity (Q2). What is consumer surplus plus producer surplus plus government revenue minus total external costs?

3. An action should be taken if and only if the benefits outweigh the costs. What are the costs of the gas tax in this example? What are the benefits? Which one outweighs the other?

4. The above example assumes the government has perfect information about the size of the externality caused by gasoline. But in reality, measuring the costs and benefits (especially when it comes to things like climate change or the effects on national security) can be difficult. Does this problem of imperfect information mean we should not impose Pigovian taxes? If you think we still should impose Pigovian taxes, what does the problem of imperfect information imply about the optimal level of taxation?

Labels: , , , ,

Wednesday, May 17, 2006

Sony Turns Up the Volume


When is a bad idea a good idea? Consider "loss leaders," where stores sell products below cost to lure consumers in to buy the sale item and then get them to purchase other stuff on which there is a higher profit margin. How about free cell phones when you sign a service contract?

Sony's announcement of its new Playstation 3 provides another example. Last Tuesday, Sony announced the release date and pricing for PS3. At $499 for the basic model, the PS3 runs about $100 more than the price of Microsoft's Xbox 360. Even so, rumor has it that Sony will take a big hit on the PS3. An article from Cnet News.com reports production costs for the PS3 at $700 to $900 per unit. (See Cnet's breakdown of costs.)

So how can losing $200-$400 on every unit make sense for Sony? It all depends on the popularity of the PS3. Product development is risky and sometimes produces costly failures. These numbers do not represent long-run average costs, and the $700 probably includes some development costs. The Cnet article notes that unit costs drop rapidly after product introduction. Since product configuration does not change after introduction, as output ramps up, Sony can expect rapidly falling component costs. Sony should be able to negotiate volume discounts for the parts and, as with most electronics products, the cost of these parts should fall over time. So, there are large startup costs but marginal cost falls as production increases. This is a common phenomenon. Cnet's sources indicate that component costs should fall to $320 after three years, which would provide a handsome margin on each PS3--nearly $200 per unit--assuming flat pricing on the PS3.

But how else could they make money?
  • Game console producers make a lot of money from the games for these systems--either through their own production or through licensing. So if Sony can break even on the PS3 console, it can still make a killing from game sales if the PS3 wins the battle of the new game systems. These can be considered tie-in sales.

  • Sony has bundled a Blu-ray DVD player into the PS3. Blu-ray is one of two competing formats for high-definition DVDs (the other is HD DVD). Sony is betting a lot of money that Blu-ray will be the dominant format for the next generation of high-definition disks. A successful PS3 would tie lots of consumers to the Blu-ray DVD format, and improve the chances of the success of this standard, which would spill over to sales of other equipment. One could call this a type of network externality.
So, selling for an initial loss may not be a losing proposition after all.

1. Could Sony be successful--win the game system battle with Microsoft--and lose the war? How?

2. When discussing loss leaders, the presumption is a product sold below cost. Which costs are we talking about: average cost, marginal cost, or some other cost?

3. Presumably our discussion implies that Sony expects to work its way down its long-run average cost (LRAC) curve. What factors affect its ability to do this? Why would Sony's production costs fall as the scale of its PS3 production increases in the long run?

4. The information indicates that production costs would fall by at least 50% over a three-year period. Is this a short enough time period for Sony to benefit from these reductions? What would the expected product life be for a game system like the PS3? What happens to the price of these systems over the product life cycle?

Harold Elder is a Professor of Economics at the University of Alabama. His research and teaching focuses on applied microeconomics, including law and economics, public sector economics, and a range of public policy topics. He regularly teaches Principles of Microeconomics in the College of Commerce and Business Administration and is the advisor for his university's Masters and Ph.D. programs.

Labels: , , ,

Wednesday, May 03, 2006

Driving Green


Suppose you're in the market for a new car. With the average gasoline price hovering around $3.00 per gallon, buying a hybrid vehicle might seem like the best way to go. Sure, the price of a Toyota Prius or Honda Civic Hybrid might cost more than their gas-guzzling counterparts, but the gas savings and tax credits offset the "green premium." Right?

Think again. Reuters reports that, despite sharply increasing gasoline prices, many hybrid vehicles are staying on car lots a lot longer than expected. And Kiplinger shows that, even in the course of five years, buying a hybrid vehicle might actually be more expensive than buying the gas-guzzling equivalent.

Suppose you want to buy a hybrid and you're going to give it to your son or daughter after five years. You should purchase a hybrid vehicle if and only if the benefits outweigh the costs. The benefits of a hybrid over a non-hybrid include an end-of-year $2,000 tax credit and gas savings accrued over the five years. The hybrid’s costs include an extra $5,000 up-front at the dealership.

We will assume gas sells for about $3.00 per gallon for the next five years, and that you will drive about 12,000 miles per year. If your traditional, non-hybrid car gets 25 miles per gallon and the hybrid will get 20 more miles per gallon, is it worth it to purchase a hybrid?

The cash flows from purchasing the hybrid vehicle rather than the gas-guzzling equivalent are shown below:


At first glance, the hybrid saves you $200 over five years, but that is deceptive because it does not account for the time value of money. If you could earn a 10% annual return investing in a high performing stock index fund, the tax credit and gas savings are worth less than what they appear. In order to calculate the hybrid’s net benefit, we must consider the time value of money, which says $1 today is worth more than $1 tomorrow, because $1 today can be immediately invested to earn a return.

The following shows the present values of the cash flows from purchasing a hybrid vehicle rather than a non-hybrid.


Net Benefit = -$756

Under these assumptions, you are better off buying a traditional car than you are buying a hybrid.

1. What if you drove 16,000 miles per year; is it worth it to buy the hybrid vehicle?

2. Driving a traditional gas-powered car imposes a negative externality (pollution) on the community. How do externalities affect your decision making?

3. Currently, there are only a few hybrid vehicles available in the market. If automakers such as Honda, Toyota, Ford, General Motors, Volkswagen, and Daimler-Chrysler realize that there are unexploited profits to be made in the hybrid vehicle market, how would this affect the premium you pay for a hybrid? If the "green premium" decreases, how would this affect the net benefit of buying a hybrid?

CLICK HERE FOR THE HYBRID CALCULATOR (EXCEL)

Topics: Finance, Externalities, Time value of money, Invisible hand, Cost benefit analysis

Labels: ,

Thursday, January 19, 2006

Trillion Dollar War?


How's this for the essay question on your next econ exam: What's the total cost of toppling Saddam Hussein and battling insurgents in Iraq? Round your answer to the nearest billion dollars and explain your tabulation.

Two recent economic research papers set out to answer this question. One study, authored by scholars from the American Enterprise Institute, estimates the cost at a minimum of $657 billion. Another study, authored by Joseph Stiglitz of Columbia and Linda Bilmes of Harvard, puts the total cost of war at upwards of $2 trillion. These estimates dwarf the initial White House projections of $200 billion, and even the $357 billion appropriated by Congress in 2002 for fighting in Afghanistan and Iraq. Why are the estimates so different?

To interpret the estimates we need to understand that the cost of war exceeds the government expenditures on fighting it. Fighting a war presents a host of opportunity costs and disruptions that do not show up in the government budget reports. Initial White House projections attempted to account for explicit costs associated with military operations in Iraq. The economic studies attempt to account for both the explicit costs and the opportunity costs that the war will generate for years to come.

War cost accounting is an inexact but informative science. Read on to see what types of questions economists try to answer when estimating the costs of war.

1. What is the Congressional Budget Office's estimate for explicit costs associated with military operations in Iraq over the next decade?

2. What are the opportunity costs of sending National Guardsmen or reservists to Iraq for extended tours of duty? What types of health care costs will the United States incur after the war? What are the opportunity costs associated with an injured soldier who cannot return to normal work after the war?

3. According to the researchers, what effect did the war in Iraq have on oil prices?

4. The high costs of the Iraq war do not necessarily mean it was a bad idea. What are the benefits associated with the war in Iraq? Are the costs of withdrawing troops from Iraq greater than the costs of keeping the troops there?

See the studies for yourself:

Stiglitz and Bilmes
Wallsten and Kosec

Topics: War, Opportunity cost, Cost-benefit analysis, Implicit costs, Explicit costs

Labels: