Friday, May 08, 2009

Why Do Monthly Job Loss Estimates Exclude the Farming Sector?


In April, nonfarm payroll employment declined by more than 500,000 jobs for the sixth month in a row. While the pace of nonfarm job losses slowed, the Bureau of Labor Statistics (BLS) report on the employment situation continues to paint a fairly grim picture. Employment in the farming sector was actually a bit higher in January 2009 (the most recent month for which data is available) than it was in January 2008. Why doesn't the BLS cover farms and ranches in its payroll survey? Might the omission of the farming sector from the BLS payroll survey cause the jobs report to be too gloomy?

According to the BLS, farms simply fall outside the scope of the payroll survey. When the BLS began studying payrolls and employment in 1915, it focused exclusively on the manufacturing sector. The need for more accurate employment estimates during the Great Depression led the BLS to develop more comprehensive estimates of wages and employment in nonfarm industries during the '30s. Historically, at least, one can imagine the relative difficulty of gathering timely employment information in the rural farming sector.

The lack of agriculture in the payroll survey, however, is almost certainly inconsequential. The absence of farms in the Bureau's payroll survey matters less to today's employment picture than it did during the early and mid 20th century. In 1930, 21.5 percent of the workforce worked in farming, and agricultural output represented nearly 8 percent of U.S. economic output. At the turn of the 21st century, less than 2 percent of the labor force worked in agriculture, a sector that now represents less than 1 percent of national economic output.

The small share of the population employed in agriculture makes it unlikely that the Bureau's payroll survey--with a sample covering about one-third of total nonfarm payroll employment--will distort the overall jobs picture by failing to account for farm sector employment. Even an agricultural boom in the midst of the current recession would do little to reverse the dismal national employment trends.

Although the BLS excludes agriculture from its payroll survey, it does capture farm employment indirectly through a survey of 60,000 households. The most widely reported unemployment rate comes from this household survey, which includes respondents from all economic sectors: manufacturing, services, agriculture, or the ranks of the self-employed.

The household survey categorizes a person as employed if they worked for pay at some point during the past week, whether she worked in a factory, on a ranch, in an office, or for herself. A person who does not have a job, but actively searched for one at some point in the preceding four weeks, is considered unemployed. Anyone who does not have a job and has not been looking in the past month is classified as "not in the labor force."

The unemployment rate is simply the ratio of unemployed workers to the labor force (the sum of employed and unemployed workers). As the ranks of the unemployed continued to swell during April, the unemployment rate rose from 8.5 percent to 8.9 percent, reflecting an increase in joblessness among all workers, including farm hands and the self-employed.

Discussion Questions

1. There are a number of jobless people who would like to work but have given up on their job search because they believe it to be futile. The BLS classifies these discouraged workers as 'not in the labor force' rather than unemployed because they did not search for a job in the preceding four weeks. Consulting this table, how does the number of discouraged workers in April 2009 compare to the number in April 2008? If the BLS were to count discouraged workers as unemployed (and, by extension, part of the labor force), what would happen to the unemployment rate?

2. How has the recession affected the ranks of discouraged workers? For more information, consult this recent BLS report.

3. The BLS tracks the number of people who work part time for economic reasons, also known as involuntary part-time workers. By counting anyone who worked for pay during the preceding week as employed, the household survey classifies a number of involuntary part-time workers as employed. In what way does the official unemployment rate miss the underemployment associated with involuntary part-time work? This table contains information on involuntary part-time workers. How has the recession impacted the number of people employed part-time for economic reasons? What happened to the number of involuntary part-time workers between March 2009 and April 2009?

4. Even as Americans eat a larger variety and quantity of foods than ever before, the share of economic output attributable to agriculture declines. How can you explain this development?

Labels: , ,

Friday, April 10, 2009

Moody's Negative Outlook on U.S. Local Government Debt


A few days ago, Moody's Investors Service announced that its outlook for the entire U.S. local government tax-backed and related ratings sector is negative. This is newsworthy not only for municipal bond investors but also for anyone following the U.S. recession. It marks the first time that Moody's issued an outlook on this entire sector, although it has issued ratings on the sector since 1914.

Moody's Investors Service is one of the leading issuers of credit ratings. Investors use these ratings to gauge the risks of investing in debt assets. So, one might conclude that the analysts at Moody's are remarkably pessimistic about the impact that recessionary economic conditions will have on the ability of local governments in the U.S. to meet their debt obligations. This means that the risk of defaults on these debts has risen.

However, Moody's hedged its announcement by mentioning that credit pressures will vary significantly across locales due to differences in economic conditions, property assessment methods, and authority to raise revenue. The varying economic conditions can largely be explained by localities' exposure to industries hit particularly hard by the recession. These include real estate development, auto manufacturing, financial services, tourism, gaming, and general manufacturing. Differences in property tax systems will play a major role. Moody's report shows evidence that about 72% of local government tax revenue comes from property taxes. The bursting of the housing market bubble will bring declines in property tax revenue for most local governments because of falling home values.

Several of these governments might have the authority to increase property, sales, or income tax rates to raise revenue. Whether the elected officials running these localities are willing to do this is an open question. Moody's points out that taxpayers are worried about their own financial conditions and are highly resistant to increases in local taxes. Raising taxes in this environment will be unusually difficult for locally elected officials.

Cutting spending during the economic crisis will not be an attractive option either. In part, this is because many of these governments may face service mandates that prevent them from reducing service-related expenditures. An example of a service mandate is that a state government may mandate that local governments provide health services for the poor. Moody's analysts also reported that the demand for improved government services will make it that much more difficult for these governments to sustain healthy finances. Local officials may find that it is more palatable to default on their bonds rather than raise taxes or cut spending.

The credit crunch is also having a direct impact on local government finance. Moody's report states that access to credit will be more expensive for these governments than it had been in recent years. Moody's negative outlook announcement surely caused investors to demand greater yields on the municipal bonds trading in the credit markets. The company also warned that some localities are in such dire straits that they may be completely shut out of the credit markets.

Yet, the situation ought to be tenable for numerous governments. For instance, some well-managed localities increased their reserves during the boom years and were prudent with the funds generated during the real estate bubble. A simple example from portfolio theory can help show why investors may still be willing to buy the bonds of a cross-section of municipalities.

Suppose that a bond investor purchases three one-year bonds with different expected returns and probabilities of default. For simplicity, we'll assume that the investor is risk-neutral and the bonds pay nothing in the event of default. Bond A has a 25% probability of default this year but pays a coupon of 15% if it avoids default. Bond B has a 50% probability of default this year but pays a coupon of 20% if it avoids default. Bond C has a 75% probability of default this year but pays a coupon of 30% if it avoids default. Let's also assume that all the bonds have a face value of $100 each.

What is the investor's expected payoff from investing in this portfolio? It is


(0.75 × $115) + (0.5 × $120) + (0.25 × $130) =

$86.25 + $60 + $32.50 = $178.75


So, on average, an investor would be willing to pay less than 60% of face value on these bonds to make a positive expected return.

This example was purposefully simple, but from it you can see the advantage of diversification and the problem of gauging risk. If the probabilities of default end up being higher than estimated, the investor might lose money but will only lose all his money in the rare case that all bond issuers default. Yet, if the probabilities of default are lower than estimated, the investor might earn a high rate of return.

Discussion Questions

1. How does the bond portfolio example relate to the impact that mortgage-backed securities had on financial institutions? What must have happened to their default rates for them to become known as "toxic assets"?

2. If you had a large sum of money that you had to use for investment purposes, would you put together a portfolio of U.S. local government debt? If yes, why? If not, explain what your preferred investment would be.

3. Besides an economic recovery, what changes, if any, do you think are needed for local governments to avoid defaults in the future? How feasible are your proposed changes?

Labels: , , , , ,

Friday, March 13, 2009

The Financial Crisis for Dummies


This is, perhaps, the most engaging and accessible explanation of the current "Great Recession" I have come across. In this 59-minute podcast, Ira Glass and his cohorts at Chicago Public Radio and NPR create an ultra-simplified world of just one eager dollhouse buyer, a would-be banker with $10 in his pocket, and a young man with $90 he wants to put into a savings account to explain the financial mess we find ourselves in. This recording explains why TARP is called TARP, what insolvency is all about, what the term toxic assets means, and why America's biggest banks are afraid to "mark it to market" or re-value those toxic assets.

After listening I have a better appreciation for the state of all things financial but I am left wondering, what's the best way out of this morass?

Discussion Questions

1. Can you point to an underlying cause that precipitated this crisis?

2. Does the government nationalize the banks for a time, robbing banks' shareholders of their investments but allowing banks to start over with a clean slate? Does it help the banks get back on their feet by purchasing toxic assets with taxpayer money at artificially high prices? What are the short and long term effects of these different strategies?

3. Do you think the United States has "learned its lesson"? Will people (and businesses and governments) change their behavior? Or are we doomed to repeat this process?

4. Are there safeguards the government can introduce that will keep this from happening in the future?

Labels:

Monday, January 05, 2009

Recession-proof


Doomsayers are coming out of the woodwork en masse as 2008 ended during a dismal economic downturn. With consumer confidence at an all-time low, the financial industry shell-shocked as grand, monolithic companies crumbled all around, and nearly 2 million jobs lost in the past year, the end looks nigh indeed.

But before you don your sandwich boards and raise high your signs, things may not be as bad everywhere as they seem.

The economy rises and falls in what's called a business cycle. Some years are relatively prosperous with rapid economic growth and expansion while other years see the economy contract or stagnate. These fluctuations last over periods of years and their timing is largely unpredictable.

Some firms stick with the general trend of the market, their business conditions weakening when the market weakens, strengthening when the market recovers. These are procyclical firms. Others, countercyclical firms, do the reverse; their business conditions weaken when the times are good, and strengthen when times are bad. There are still other industries that don't depend on how the economy is doing at all.

So, while the bankruptcies and bailouts get the boldest headlines these days, here's a brief list of industries that are doing just fine.
  • The funeral services industry depends more on long-term trends such as aging populations and baby booms rather than on the twitching of the stock ticker. And of course, it also helps that their services are always in demand.
  • The entertainment industry is another good example. Revenue from concerts and movies have stayed strong during this economic downturn. Faced with gloom and doom, many find the few hours of escapism well worth the price of admission.
  • Discount stores, most notably Wal-Mart, are attracting cash-strapped customers looking to get the most out of their money.
  • As jobs get scarcer, going back to school makes a lot of sense for those looking to weather the fierce competition in the job market and to improve their skills and credentials. According to the Labor Department, the education industry has added 9,800 jobs in November.
Discussion Questions

1) What are other examples of procyclical industries? Countercyclical industries?

2) During the economic boom of the '90s, how did countercyclical industries do? Did more people drop out of school and enter the labor force? Did Wal-Mart suffer a decrease in sales?

3) Do you think prices, in general, drop during a recession? Why or why not?

4) How much do you think countercyclical firms contribute to an economy's eventual recovery?

Labels: , ,

Friday, December 19, 2008

The Federal Reserve’s New Target Range


On December 16, 2008, one of the most significant monetary policy decisions in US history was handed down by the Federal Reserve's Open Market Committee (FOMC). In an effort to combat accelerating deflation in the Consumer Price Index (CPI) and massive job losses, the FOMC announced a reduction of its federal funds rate target from 1% to an unprecedented range of 0% to 0.25%. While critics of the move might point to relatively stable core inflation rates (which exclude food and energy), the FOMC was clearly more concerned about the state of the job market and the accelerating deflation reflected in the headline CPI. In fact, for two consecutive months, the US experienced record CPI deflation with rates of -1% in October and -1.7% in November of 2008. Along with OPEC's attempts to curtail oil production, this move by the FOMC is likely to help stabilize the price level.

The Fed announcement is historic for the low level of rates in its targeting and for the unique setting of a target range. This gives the Fed modest room for flexibility above the nominal floor of a zero federal funds rate. Whether it will be enough to spur the feeble economy is doubtful. Fortunately, the FOMC also announced that the federal funds rate is likely to remain within the target range for an extended period. The central bank is also prepared to purchase agency debt and mortgage-backed securities. Furthermore, through the Fed's expanded toolkit, it will begin direct loans to households and small businesses starting in 2009.

Fed chairman Ben Bernanke recognizes that the US economy is ripe for implementing the tenets of his Bernanke Doctrine, outlined in his 2002 speech titled "Deflation: Making Sure 'It' Doesn't Happen Here." In that speech, well before he was appointed to chair the Fed, he stated, "the economic effects of a deflationary episode, for the most part, are similar to those of any other sharp decline in aggregate spending—namely, recession, rising unemployment, and financial stress." Bernanke now has the chance to run the Fed during the precise scenario that he described six years ago.

In fact, the FOMC's press release of December 16, 2008 announces policy that effectively implements most of the seven steps of the Bernanke Doctrine. The FOMC's bold move may stave off a severe recession, but it does not come without potential costs. The combination of aggressive monetary policy, and recent and proposed fiscal stimulus could eventually reduce confidence in the US Treasury's ability to service its debts.

For the time being, Chairman Bernanke appears to be doing what is necessary to support another of his statements from six years ago:

Let me end my talk by abusing slightly my status as an official representative of the Federal Reserve System. I would like to say to Milton and Anna [Friedman]: Regarding the Great Depression. You're right, we did it. We're very sorry. But thanks to you, we won't do it again.

Discussion Questions

1. What could be the negative ramifications of implementing such a bold expansionary monetary policy at this time? How likely do you think it is that such negative ramifications occur?

2. Do you believe that historically low interest rates will be sufficient to save businesses struggling to avoid bankruptcy, such as those in the auto industry?

3. The current state of the US economy bears remarkable similarity to that of the beginning of the Great Depression. Do you think that Chairman Bernanke and his doctrine will keep the US out of a deflationary spiral? Will the doctrine, along with fiscal policy from recently elected officials, be enough to keep America out of a depression?

4. The US national debt held by the public is currently about $6.4 trillion or 45% of the nominal GDP in 2008. Is there any reason to worry over the ability of the US Treasury to meet national debt obligations? Why or why not?

5. Now that gasoline prices have returned to low levels, some economists may believe that it is an appropriate time to raise the federal gasoline tax. Do you agree with this position? Why or why not?

Labels: , , , , , ,

Friday, December 12, 2008

Should the Government Bail Out the Auto Industry?


America's Big Three—General Motors, Chrysler, and Ford—are in big trouble. Sales from the not-so-fuel-efficient fleet of American-made vehicles had already suffered considerably because of high gas prices even before the financial crisis began to get serious in September of 2008. Faced with undesirable terms in private credit markets, the Big Three are now turning to the government for financial assistance. The House passed a bill to rescue the Big Three car companies with $15 billion in emergency loans on Wednesday, December 10, but the Senate abandoned the plan the day after. Should the government bail out the auto industry?

Those in favor of the bill argued that the rescue plan can prevent the loss of 500,000 jobs in the auto industry. Job losses in the auto sector would most likely have spillover effects in other sectors. As auto workers lose their jobs, they would consume fewer goods and services, negatively affecting industries in retail, health care, and financial services. With unemployment already rising, supporters of the bailout argued that keeping auto workers in their jobs is much easier than creating new jobs for them.

Opponents of the bill compared the bailout to the inefficiencies generated by government subsidies and tariffs. Many companies face financial problems—why should the government save the Big Three and not the others? Poor performance is typically a good signal that a company should change how and what it produces. A partial government takeover of American auto companies will not ensure that the firms will start producing vehicles that people want to buy. A bailout, according to critics, will simply prolong the inevitable: the consolidation of the American auto industry, the large number of layoffs that come with it, and the migration of workers from autos to more profitable industries.

Discussion Questions

1. What is the role of labor unions in contributing to the financial problems facing the Big Three? In particular, how well do the wages reflect the productivity of the workers in the Big Three? Click here to read more.

2. Do you think the problems faced by the Big Three stem primarily from the recent financial crisis or from longer-term decisions about what types of vehicles to produce and how to produce them?

3. Some suggest that another reason leading to the failure of the Big Three is that American consumers prefer cars made by foreign companies, such as Toyota and Honda, to cars made by American-owned companies. How does the market of foreign-made cars affect the demand for American cars?

4. Foreign-owned automakers, like Toyota and Honda, operate production facilities in the United States and employ American workers. How would these firms be affected by a bailout of the American-owned Big Three? How will foreign auto firms with operations in and outside of the United States be affected if one or more members of the Big Three were allowed to fail?

5. How do the loans compare with tariffs in foreign trade? What advantages and disadvantages do they share in common?

6. What would happen to the broader economy if the plants closed and workers became laid off? What might these workers do to find new employment? Which sectors would employ them?

Labels: , , , ,

Friday, November 21, 2008

Should We Be Worried About Deflation?


We're used to low and stable inflation in the United States—a slow, but steady increase in the prices of goods and services over time. The inflation rate measures the pace at which prices rise over time. The table below shows the CPI (consumer price index)—which measures the average price of a representative basket of consumer goods and services—from July to October in 2007 and 2008, as well as the annual inflation rate. In recent months, the U.S. economy experienced disinflation—the annual inflation rate, while positive, declined from a peak of 5.6% in July to 3.7% in October. The CPI continues to rise year-on-year, but it's doing so at a slower and slower pace.

Notice that the CPI declined significantly in October 2008 (from 218.8 in Sep '08 to 216.6 in Oct '08). In fact, the 1% decrease in consumer prices during October 2008 was the largest one month decline in 61 years. The sharp month-on-month decline in prices raised some fear of deflation. Deflation occurs when the prices of goods and services fall over time. Persistent deflation leads to negative annual inflation rates.


A sharp reduction in total spending by businesses and consumers typically precedes an overall drop in prices. For deflation to persist, business and consumer expectations must adjust. If people expect prices to continue falling, they will postpone purchases. Why buy today what can be obtained more cheaply tomorrow? The postponed spending reduces the current demand for goods and services. With weaker demand, prices fall even further and firms begin to cut back on production and lay off workers. Should we be concerned about this type of deflationary spiral?

Exploring the difference between headline and core inflation can help us answer this question. Headline inflation, reported in the table above, measures changes in all consumer prices. Core inflation measures changes in the CPI excluding food and energy prices. Since food and energy prices tend to be volatile compared to other prices, removing them from the CPI can allow economists to obtain a less distorted view of the inflation trend. The core inflation picture for October 2008 is far less alarming—the CPI less food and energy prices barely registered a change.

Falling energy prices were the primary cause of headline deflation in the month of October. A decrease in the relative price of energy is not necessarily a bad thing. A good's relative price is measured in physical units. Suppose that, in May 2008, the price of gas was $4 per gallon and the price of a movie ticket was $8. To express the relative price of gas in May 2008, we'd say that one gallon of gas cost one-half of a movie ticket. If, in October 2008, gas is down to $2 per gallon but movie tickets still cost $8, we'd say that the relative price of gas is one-quarter of a movie ticket. In other words, gas has become relatively cheaper since energy prices are falling as other prices remain largely the same.

Nobody's complaining about relatively inexpensive gas. Declining energy prices will likely feed through to the prices of other goods and services in the coming months. We may even see a negative year-on-year inflation rate. But a damaging deflationary spiral still seems like a remote possibility. Only when consumers and businesses begin to build expectations of falling prices into their decisions will deflation become a real threat.

Discussion Questions

1. Deflation presents big problems for debtors. Recall that the real interest rate a borrow pays on a loan is equal to the nominal interest rate minus the inflation rate. If you take out a fixed rate loan with a nominal rate of 8% and expected inflation of 2%, you'd expect to pay a real rate of 6%. What happens to your real rate if falling prices push the actual inflation rate to -1%?

2. What would deflation do to the purchasing power of a debtor's principal balance? For instance, how would persistent deflation affect people's ability to repay home loans? How would it affect the already beleaguered housing market?

3. If the Fed fears persistent deflation, what policies should it pursue to ensure that deflationary expectations do not develop? What are the risks associated with anti-deflationary monetary policy? How could government fiscal policy assist the Fed in preventing deflation?

Labels: , , , ,

Friday, November 14, 2008

America's Looming Liquidity Trap


In October 2008, the US unemployment rate hit 6.5%, a 14-and-a-half year high, as announced by the Labor Department. This lofty rate is likely to increase in the coming months in the wake of the ongoing financial crisis and adjustments in the real estate market. It also comes despite two 50 basis point cuts in the target federal funds rate made by the Federal Reserve during that month. These interest rate reductions brought the target fed funds rate down to 1%, a very low target rate by historical standards and close to the nominal rate floor of 0%. The Federal Reserve therefore finds itself in the thorny situation of having only 100 basis points left to work with for possible target rate cuts. (Note that a basis point represents 1/100th of a percentage point, so 1% is 100 basis points.)

The fed funds rate cannot go below 0% because a transaction at a negative nominal rate implies a negative nominal cost of borrowing funds. Furthermore, that implies a positive nominal payoff to the borrower and a positive nominal loss to the lender. Under typical, positive rates of inflation, the real costs and payoffs are amplified. This is shown in the following Fisher equation where i is the nominal interest rate, r is the real interest rate, and is the inflation rate:


This floor for the nominal fed funds rate brings up the very real possibility that the US will soon be mired in a liquidity trap—a situation in which "the monetary authority is unable to stimulate the economy with traditional monetary policy tools." One explanation for this weakness of monetary policy comes from the analysis on the real interest rate given above. In difficult economic times, why would financial institutions take on the risk of lending out money to a borrower who may default on the loan when the real return on even a fully repaid loan is negative!

An excellent source on how our nation might remedy its liquidity trap is given by the 2008 Nobel Laureate in Economic Sciences, Paul Krugman. His 1999 article "Thinking About the Liquidity Trap" offered policy solutions for springing the Japanese economy from the type of liquidity trap that now threatens the United States. Krugman's figure 1 from that paper shows a nice IS-LM example of the ineffectiveness of monetary policy. Wikipedia provides a good introduction to the IS-LM model. Below I present a modified version of Krugman's figure 1, in the context of current US interest rates, to represent traditional monetary expansion with a looming liquidity trap.


An economy may also happen to face declining consumption expenditures, as the US currently does, due to concerns about a rising unemployment rate, which can result in lower exogenous consumption and a falling marginal propensity to consume. In that case, the resulting leftward movements of the IS curve make monetary policy even less effective. Krugman's solution to the scenario is to have the monetary authorities credibly commit to sustained higher future inflation. The expectation that such higher inflation will eat away at the purchasing power of cash holdings should convince consumers to ramp up their spending and move the IS curve rightward.

President-elect Obama and the new Congress will undoubtedly undertake expansionary fiscal policy to attempt to move the IS curve rightward. However, our already massive national debt and the likelihood of waste involved in government spending, support Krugman's solution. Our newly elected officials and the Federal Reserve Board are facing unenviable policy choices.

Discussion Questions

1. Suppose that you were in control of US fiscal and monetary policy. What policies, if any, would you implement to improve US economic conditions?

2. Do you believe that America will soon face a liquidity trap? Why or why not?

3. The International Monetary Fund forecasts that the world's rich economies will collectively experience economic contraction for the first time since World War II. When was the last time America faced a liquidity trap? What circumstances led to that liquidity trap environment?

Labels: , , , , , , , ,

Friday, October 10, 2008

The Federal Reserve's Expanding Toolkit


On October 8 and 9, major central banks in Europe, the Americas, and Asia took the exceptional step of reducing interest rates in concert to stave off a global economic slowdown during the ongoing financial crisis.


The financial crisis is rooted in the faltering U.S. housing market. Many banks and financial institutions hold assets (such as mortgage-backed securities) that are tied to home loans. As house prices fall and more Americans have trouble paying their mortgages, these assets lose value, and financial institutions find their holdings are worth far less than expected. Such losses hamper the ability of financial institutions to borrow and lend. At the moment, financial institutions are very reluctant to lend to one another for fear of further exposing themselves to mortgage-related losses.


To combat this crisis of confidence, the Fed is dramatically expanding its role as the lender of last resort in the U.S. financial system. In addition to the coordinated rate cut, the Fed's new policy measures include direct loans to insurers and businesses, as well as an unusual level of cooperation with the U.S. Treasury Department. National Public Radio's Laura Conway catalogues the Fed's expanding monetary policy toolkit here.


Discussion Questions

1. Historically, the Fed's status as lender of last resort extended only to commercial banks. How has the scope of the Fed's lending changed as a result of the crisis?

2. Why don't central banks coordinate monetary policy more often?

3. If effective, how will the Treasury's $700 billion rescue package help the Fed's efforts to restore confidence among banks and financial institutions?

4. What constraints do central banks face in responding to the financial crisis?

Labels: , , , ,

Thursday, September 18, 2008

Financial Market Risks and Negative Nominal T-bill Rates


On September 17, in the immediate aftermath of the Lehman Brothers bankruptcy, the AIG bailout, and the mortgage crisis, negative nominal Treasury bill rates briefly appeared for the first time since January 1940. As Madlen Read points out, a negative nominal Treasury bill rate implies that “investors were willing to take a small loss on the security.”

At first glance, such behavior on the part of seasoned investors seems odd. Why pay more for a security than the amount the US Federal government guarantees to pay you in the future1? One possibility would be that the general price level could fall so that the smaller future payment would represent more purchasing power than the current price of the security. That is, if the price level falls enough, the $1000 payment one receives in several months could buy more than, say the $1000.05 price of the bill could buy today. There is some evidence for this: the US Bureau of Labor Statistics reports that in 2008, on a monthly basis, the percentage change in the CPI was 1.1% in June, 0.8% in July, and –0.1% in August. However, if that is the case, one would still get more purchasing power by holding the $1000.05 in cash through the period of falling prices than by receiving only $1000 in the future. Yet, where can such cash be stored safely?

A more likely explanation is that growing fears of systemic risk have discouraged investors from holding any but the safest financial assets. One example of systemic risk comes from the Reserve Primary Fund, the oldest U.S. money-market fund, which lost two-thirds of its asset value due to its investment in Lehman Brothers’s debt. Wary investors fear that similar losses could threaten other financial institutions. Since US Treasuries are generally considered to be the safest investment possible, there was apparently a rush to invest in these securities. Therefore, an increase in demand for T-bills was likely accompanied by a reduced willingness to sell such securities. The latter represents a decline in the supply of T-bills. Both sides of the market then acted in unison to push up the price of T-bills to such an extent that their sales prices briefly exceeded their maturity values. The maturity value, represented on the graph below by the M=1000 line, is the amount, typically $1000, that the bill specifies will be paid to the owner at maturity.


We can solve for the negative nominal rate mathematically using the following formula:


where M is the bill’s maturity value, PB is the bill’s price, and r is its annualized rate of return on the bill when it is held to maturity.

To illustrate the negative rate phenomenon, suppose that for a $1000 maturity value, the market trades a 3-month T-bill at a price of $1000.05. The nominal rate of return, r, is therefore –.02%.

Negative nominal rates were described here in the context of the Japanese market by Daniel L. Thornton in the January 1999 issue of "Monetary Trends." In the article, Thornton states that “investors are willing to accept a negative nominal return on a risk-free asset because holding it is cheaper and less risky than transporting and storing cash.” So it seems that for one day at least, investors were willing to lock in a nominal loss on a safe asset rather than risk leaving cash in financial institutions.

Discussion Questions
1. The Lehman Brothers bankruptcy, the AIG bailout, and the mortgage crisis have apparently shaken investor confidence in financial institutions. Do you think their fears are justified? Do you believe that these financial events have had an impact on your life? If yes, how, and if not, then why not?

2. How might forecasts of a falling general price level in the near future help to explain investors' willingness to accept negative nominal T-bill rates?

3. The dramatic shifting of funds into the safety of Treasuries implies that funds left other sectors. With many financial sites available, you can find information the returns on various financial assets online. Which investment sectors had the largest declines on Sept. 17, 2008? Which investment sectors had the largest gains on that day? How would you explain the results that you found?
-------------------------------------
1 Recall that T-bills have zero coupons which means that they make no payment until the maturity date.

Labels: , , , , ,

Thursday, April 03, 2008

The Per Capita Recession


GDP (Gross Domestic Product) is a statistic that economists use to gauge the output of a nation. Movements in GDP provide clues about the health of an economy.

Look at GDP growth over the last five years, and the United States comes out smelling like roses, relative to other high-income countries, at nearly 3% growth per year. But statistics can be deceiving.

An article from the Economist titled “Grossly Distorted Picture,” questions whether GDP is an accurate measure of a nation’s economic health. The article suggests that, though GDP growth for the United States is higher than other countries, other factors, like population, also play an important role. As the article points out, growth of GDP per person is perhaps a more meaningful measure of economic progress than simply growth of GDP.

For example, over the same four-year period (2003-2007) Japan’s GDP growth was just over 2%, far below the nearly 3% growth the United States experienced. But during that time, Japan’s population was shrinking while the population of the United States was growing at nearly 1% per year.

If you calculate GDP per person Japan’s economy actually grew faster (2.1%) than that of the United States (1.9%).

Discussion Questions

1. Which countries have the biggest discrepancies between GDP growth and GDP per person over the last five years? Does that change your perceptions of the health of these nations?

2. As the article points out, annual U.S. population growth is roughly 1%. The annualized growth of U.S. real GDP (real GDP is an inflation-adjusted measure of output) was 0.6% during the last three months of 2007. Assuming U.S. real GDP growth in the first three months of 2008 was about the same—what does this imply for U.S. GDP per person?

3. Economists typically define a recession as six months or more of declining real GDP How would the use of real GDP per person rather than real GDP change our perspective on recent U.S. economic performance? According to this method, is the U.S. economy in recession?

4. As gauges of economic output, both GDP and GDP per person have their flaws. For starters, each measure misses the value of things that are not traded in a legitimate marketplace but may nonetheless impact our economic well-being. Underground activity, whether illicit drug dealing or benign babysitting, does not register in national income accounts. Environmental damage associated with our production and consumption is also not a factor. Can you think of other statistics we should consider when measuring a nation's economic health? What are some of the benefits and drawbacks to those methods?

Labels: , ,

Monday, March 10, 2008

Conflicting Employment Figures


The government's monthly survey of businesses indicates that payrolls experienced a net drop of 63,000 jobs during February. At the same time, numbers from the government's monthly survey of households indicated that the unemployment rate declined from 4.9% in January to 4.8% in February. How can the unemployment rate fall even as the economy sheds jobs? Understanding this paradox requires a closer look at the household survey numbers for the past two months.


* Numbers in thousands

The household survey indicates that the number of employed persons saw a net decline between January and February. The ranks of the employed thinned by about 255,000 people. Normally, the net drop in the number of employed people would cause the ranks of the unemployed to swell by a similar amount. The government considers a person unemployed if she lacks a job but has actively searched for one in the past four weeks. Yet, the pool of unemployed workers actually shrank by about 195,000 people between January and February. The change in the size of the labor force over the same period provides some clues as to why.

The number of people dropping out of the labor force in February exceeded the number of new entrants—on net about 450,000 people left the labor force. These people either left jobs with no intent of finding another or gave up on their employment searches altogether. If you want a job but you're so frustrated with past failures to find one that you stop looking, the government classifies you as a discouraged worker and no longer considers you to be part of the labor force.

All things being equal, February's employment drop of 255,000 should have increased the pool of unemployed workers from 7.58 million to 7.83 million. Things weren't equal though, as a number of people considered unemployed in January gave up on their job searches in February, contributing to the 450,000 person drop in the size of the labor force and causing the number of unemployed workers to come in at 7.38 million in February rather than 7.58 million. If we assume that all 450,000 people became discouraged workers in February, the drop in the ranks of the unemployed and, consequently, the labor force, reflects the inability of those out of work to find compatible job vacancies.

The unemployment rate is simply the ratio of unemployed people to the size of the labor force (unemployed / labor force). Since the ranks of the unemployed declined by 2.6% and the size of the labor force declined by only 0.3%, the fraction of the labor force considered unemployed declined from 4.9% in January (7,576 / 153,824) to 4.8% in February (7,381 / 153,374). In this peculiar case, the small drop in the unemployment rate reflects economic weakness rather than economic strength.

Discussion Questions

1. Here's what the employment numbers for February would have looked liked if the 450,000 people who left the labor force had remained in the labor force as jobless workers actively searching for employment (unemployed people):


* Numbers in thousands

Under these conditions, what would the unemployment rate have been for the month of February 2008?

2. You can find the Bureau of Labor Statistic's (BLS) news release for February 2008 here. The national unemployment rate is at best a rough gauge of joblessness in the United States. The February numbers illustrate how the unemployment rate can paint a misleading picture of labor market strength. A fuller understanding of labor market issues requires a closer look at employment figures. How do the unemployment rates for specific age and racial groups differ from the national rate?

3. According to the BLS, who are the people who “work part time for economic reasons”? What has happened to their numbers over the past year? Does the unemployment rate capture changes in the number of folks who work part time for economic reasons?

4. Our assumption that all 450,000 people who left the labor force in February became discouraged workers is unrealistic. (Indeed, the BLS only counted a total of 396,000 discouraged workers in February.) Who, according to the BLS news release, is considered a “marginally attached worker”? Are all marginally attached workers also discouraged workers?

5. An unemployment rate of just below 5% is still relatively low by historical standards. Nonetheless, tepid employment reports in January and February darken the U.S. economic outlook when considered along side reports of weak output growth and continuing turmoil in housing and financial markets. Keeping in mind that the Fed's recent rate cuts and the government's tax rebates will begin to impact the economy in May and June, what type of economic performance do you expect in the United States for 2008?

Labels: ,

Tuesday, January 22, 2008

Creating Money (or Jobs) Out of Thin Air


Today, amid foreign financial market volatility, the Federal Reserve cut the federal funds rate from 4.25% to 3.5% to prevent a recession. You may read the official press release here. The move is rare for two reasons. The Federal Reserve reduced the federal funds rate before its regularly scheduled meeting next week, and the Federal Reserve reduced the rate by 75 basis points, as opposed to its usual 25 or 50 basis point increments. In summary, today’s move is rare for its timing and magnitude.

The federal funds rate, or the interest rate that U.S. banks charge each other for overnight loans, is the benchmark rate for many short-term and long-term interest rates in the United States. A reduction in the federal funds rate, often times (though not always), decreases the interest rate on credit cards, automobile loans, and mortgages. Lower interest rates encourage consumers to spend and businesses to build new offices and purchase computers, machinery, and software. A boost in consumption (e.g. buying new clothes) and investment (e.g. building new offices) spending are exactly what the economy needs when it is slipping into a recession caused by sudden drops in overall spending. Though the U.S. economy is NOT officially in a recession, the Federal Reserve forecasts “slowed growth” and would like to cut rates just-in-case.

The previous explanation shows how the Federal Reserve could use monetary policy to minimize the depth and length of a recession. However, what is less well known is the process with which the Federal Reserve is able to manipulate the federal funds rate. Essentially, the Federal Reserve lowers the federal funds rate by expanding the money supply. This is easier said than done.

First and foremost, the Federal Reserve does NOT print new dollar bills. So how is it able to create new money? There are two main forms of money—cash in circulation and checking deposits held in banks. Separate from the money supply are “reserve accounts” that commercial banks are required to have at the Federal Reserve. These reserve accounts hold cash for the commercial banks in case depositors cash-out some of their deposits.

The Federal Reserve can expand the money supply by expanding the amount of deposits held in the U.S. commercial banking system. One way to do so is to purchase U.S. government bonds issued by the U.S. Treasury department. When the Federal Reserve purchases government bonds from commercial banks, it takes bonds out of circulation and electronically credits reserve accounts. U.S. commercial banks armed with more cash reserves will issue new loans which are then deposited back into the banking system. This method effectively increases the dollar amount of checking deposits in the economy, and hence, expands the money supply.

Discussion Questions

1. Suppose U.S. commercial banks are highly reluctant to issue new loans even if they are armed with more reserves. How would this impact the Federal Reserve’s ability to expand the money supply and lower the federal funds rate?

2. Republican presidential candidate, Ron Paul, believes that the Federal Reserve “debases and depreciates” the currency through its manipulation of the money supply. In fact, he wants to abolish the Federal Reserve altogether. Using the definition of the money supply and the relationship between interest rates and unemployment, how could the money supply be “pro-cyclical” without the Federal Reserve?

Labels: , , ,

Thursday, January 17, 2008

What's a Fiscal Authority to Do?


The likelihood of slow growth or a recession in the United States has policymakers looking for ways to soften the blow. There are two basic ways the government can stabilize output: monetary policy (changes in the money supply and interest rates) or fiscal policy (changes in government taxation and spending). The U.S. monetary authority, the Federal Reserve (or Fed), responded to the threat of recession by lowering interest rates. Lower interest rates reduce the cost of borrowing, accommodating investment and consumption spending during downturns (with the added benefit of lowering the value of the dollar and thus boosting U.S. exports). The timing and magnitude of interest-rate changes are always tricky, but even if rate cuts don't avert a downturn altogether, they'll almost certainly reduce the depth and length of a recession.

But what, if anything, can the fiscal authority—Congress and the President—do to assist the economy? According to Fed chair Ben Bernanke, "Fiscal action could be helpful in principle, as fiscal and monetary stimulus together may provide broader support for the economy than monetary actions alone." (Read this New York Times article for more.) However, Bernanke is hedging a bit here. By saying that tax cuts or spending increases "could be helpful in principle," he implicitly acknowledges that such measures may be ineffective, or even harmful, in practice. The process of agreeing on and passing legislation limits the usefulness of fiscal policy for stabilizing mild fluctuations in economic output. By the time our representatives haggle over and pass legislation, the downturn may be over or the resulting policy may reflect political rather than economic considerations. For this reason and others, recent commentaries by Greg Mankiw and Robert J. Samuelson argue that we should leave the Fed to address mild ups and downs in the business cycle, reserving fiscal policy for deep or prolonged recessions.

Discussion Questions

1. Limitations of fiscal policy aside, Bernanke seems to understand that politicians seeking a track record to run on will often favor policy action over informed inaction. What advice does he give policymakers who are eager to implement fiscal policy?

2. Three specific types of "lag" may delay the beneficial effects of economic policies. The recognition lag is the time it takes us to figure out we're in an economic pickle. We often don't know that we're in a recession until months after it's started. The implementation lag is the time it takes policymakers to agree on and implement policies. The impact lag is the time it takes a policy to work its way through the economy and affect economic output and unemployment. For example, an increase in government spending on highway construction will show up as additional output over the entire life of the project, not all at once. How might these lag times differ between monetary and fiscal policy?

3. Plotting economic output over time reveals two basic observations: the smooth upward trend in output growth over the long haul, and the up-and-down wiggle of output in the short term. To paraphrase Aplia's founder Paul Romer, it's easy to lose sight of the trend for the wiggle. Policymakers can get so wrapped up in temporary economic tumults that they lose focus on the bigger picture. If we're headed for recession, odds are that it will be mild by historical standards and the Fed will have plenty of policy ammunition to soften its adverse effects. Meanwhile, small changes in the long-run rate of economic growth have large impacts on future living standards. Given that, what policies would you recommend the action-minded fiscal authority focus on to improve the long-term growth prospects of the U.S. economy?

For more on the appropriate role of fiscal policy, listen to Bloomberg’s interview with Stanford economist John Taylor.

Labels: , , , ,

Thursday, October 04, 2007

Loss Aversion and the Housing Market


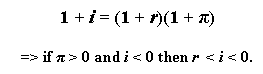
For many people, the pain of losing $500 outweighs the pleasure of gaining $500. As Austan Goolsbee points out in a recent New York Times column, this aversion to loss is especially acute when it comes to selling real estate. People are stubborn about selling a house for less than they paid for it. If selling at prevailing market prices means accepting a significant loss, some people refuse to sell at all, or else base pricing decisions not on what they would willingly pay to buy a similar house today, but rather on what they paid for the house when they bought it. As a result, sellers who bought houses during the peak of the housing boom will list their properties for a higher price than nearly identical homes purchased earlier on at lower prices. At worst, the strong reluctance to sell at a loss leads to a prolonged freeze in the housing market, with many homes listed for sale at prices that buyers will not pay. Since people who sell a house often go on to purchase another, loss aversion can contribute to weaker housing demand and prolong the housing slump.

The housing correction in the U.S. continues to reduce house prices in many regional markets. The correction raises the risk of a downturn in the U.S. economy. As house prices decline (other things being equal), household wealth declines, and consumption expenditures decrease. The shock to consumption spending may contribute to slower growth or even a recession. As Goolsbee points out, loss aversion in the housing market adds to the gloomy outlook for the broader economy. The reduction in housing-market transactions affects the consumption of durable goods and increases the costs associated with switching jobs. Read Goolsbee's column to find out more.

Discussion Questions

1. According to the article, what fraction of home buyers are moving within a metropolitan area? How will seller reluctance to lower prices during a housing slump affect the number of future buyers in a local housing market?

2. Suppose a beet farmer arrives at the farmers' market only to discover that other beet farmers are selling identical beets for less than he had intended to sell his own beets. He is likely to succumb to competitive forces and sell his beets at the prevailing price. Why are house sellers, unlike beet farmers, unwilling to lower their prices? Does it have to do with characteristics of the sellers or characteristics of the markets?

3. What are durable goods? Why would this type of housing-market freeze impact sales of durable goods? Why do you think the ups and downs of durable-goods sales are closely aligned with the ups and downs of the business cycle?

4. Frictional unemployment refers to the relatively short spells of unemployment associated with finding and transitioning to a new job. For example, a recent college graduate searching for her first job or a banker transitioning between jobs in different areas will be frictionally unemployed until they start at their new positions. How might a prolonged housing freeze increase frictional unemployment? To what extent might a housing freeze cause people to stay in jobs they would otherwise leave?

Labels: , , ,

Friday, September 14, 2007

The Fed's Rate Cut


As Greg Mankiw recently pointed out and Wall Street Journal reporter David Wessel was quick to observe nearly a month ago, the actual federal funds rate has been trading below the Fed's target federal funds rate of 5.25%. The federal funds rate is the rate at which banks borrow from one another overnight, and it is the key benchmark interest rate for monetary policy. The Fed targets a relatively low, or loose, fed funds rate in order to encourage borrowing, speed up economic growth, and avoid recession. The Fed targets a neutral rate when it wants neither slower nor faster growth than the economy is currently experiencing. The Fed targets a relatively high, or tight, rate when it wants to discourage some borrowing, slow the pace of economic growth, and ensure price stability (low and stable inflation).

According to Mankiw, the actual fed funds rate averaged 5.02% during August—23 basis points lower than the target—while in the preceding 13 months, the Fed had never allowed the actual rate to deviate from the target by more than 1 basis point. Although we can't be sure until the next Federal Open Market Committee (FOMC) meeting on Tuesday, September 18, the behavior of the actual rate in August seems to suggest that the Fed will cut the target federal funds rate to at least 5.0%. A rate cut would mean that the Fed is backing away from a tighter policy stance associated with reducing inflation, and moving instead toward a more neutral monetary policy that will allow it to wait and see how the recent subprime and housing-market turmoil plays out in the broader economy.

The prospect of a rate cut raises the issue of moral hazard. Some critics feel that any loosening by the Fed will bail out borrowers who have taken on risky subprime mortgages and investors who have purchased the assets backed by such mortgages. By cutting rates, the Fed may encourage borrowers, lenders, and investors to make similar gambles in the future on the assumption that the Fed will intervene if things turn sour. Tyler Cowen's latest New York Times column argues that while the Fed should not go out of its way to help poor decision makers, the Fed's mandate—price stability and full employment—should not be sacrificed for fear of instigating moral hazard.

Discussion Questions

1. If banks become increasingly reluctant to lend to one another and to individual borrowers, what will happen to the types of consumption and investment expenditures that are typically financed by borrowing?

2. If borrowing difficulties persist for an extended period of time, what would you expect to happen to housing prices? What about economic growth? How should the Fed respond to this type of credit crunch?

3. Consider the borrowers, lenders, and investors who made poor decisions in the subprime market. Will some of them benefit from an FOMC decision to cut rates? Can the Fed prevent all moral hazard associated with monetary policy decisions? Can Fed policy provide total relief to the borrowers, lenders, and investors who made poor decisions in the subprime markets?

Labels: , , ,

Thursday, September 06, 2007

Financial Contagion in Credit Markets


The ongoing U.S. subprime credit crisis has received significant attention from the domestic media and even here on the Aplia Econ Blog. However, recent developments suggest that this credit crisis might be spreading to the rest of the world. Around the globe, a credit crunch is being felt in subprime markets, as well as in safer prime mortgages and leveraged lending. The World Bank defines financial contagion as "the cross-country transmission of shocks or... general cross-country spillover effects," but notes that the term is generally used to describe the spread of financial crises. Distress in one country's financial system can be "contagious" and spread to other countries whose interests are tied to the "sick" country.

When a financial crisis begins to take hold, the old saying goes that "cash is king," leading investors to sell off securities and flock from risky positions. The result is depressed stock prices, lower Treasury yields, and higher default spreads. Default, or credit, spreads are the additional premium investors require to hold a security based upon its default risk. According to the article, many carriers of the crisis "bug" are credit hedge funds that face rising leverage due to falling collateral values, illiquid markets, and tighter lending policies from brokers. Leverage exists when investors finance their investments with borrowed funds (debt).

The effect of financial contagion is stronger the more institutions and investors in different countries have vested interests in each other's financial markets. These interests may be direct equity or fixed-income investments, or they may be complex financial arrangements (which may or may not be collateralized), such as interest or exchange-rate swaps, or arbitrage portfolios designed to profit from market imprecision.

A famous illustration of the effects of financial contagion is the case of Long-Term Capital Management (LTCM), a hedge fund founded by bond guru John Meriwether whose board of directors included Nobel laureates Myron Scholes and Robert Merton. LTCM's fixed-income arbitrage strategies provided investors with astonishing returns over its first few years, until a series of unfortunate events in 1997 and 1998 crippled the fund. The collapse of the Thailand property market spread throughout east Asia, causing panic and massive selling as market volatility soared to record heights. LTCM believed it was properly hedged to weather the storm—as long as the Asian crisis was an isolated event. Unfortunately, it wasn't: in August 1998, Russia unexpectedly refused to honor its international debt, causing investors to flock toward liquidity in the U.S. Treasury market. The real effect of these crises was to cause investors to take cover from losses and to cause markets to behave in unprecedented ways.

Discussion Questions

1. Interest rates are supposed to reflect an investment's risk. Why is it, then, that in a financial crisis (like the current subprime fiasco), Treasury yields actually go down?

2. What might be a larger concern regarding contagion if it extends beyond financial markets?

3. Why does a financial crisis that causes depressed stock prices and asset values also cause investors' and institutions' leverage to increase?

4. The effect of leverage can be quite staggering, as seen in the case of LTCM, whose ratio of assets to liquid capital reached 30 to 1 in the middle of its meltdown. Suppose you run a hedge fund that leverages a $20 million equity investment into $100 million of managed assets. If poor market conditions cause your fund's managed assets to decline in value by 5%, the new value of managed assets becomes $95 million. But what is the percentage decline in value of your fund's equity position?

5. Drawing from the previous example, imagine now that your fund is even more leveraged, and the $100 million in assets is supported by only a $10 million equity position. Now what is the percentage decline in your fund's equity position due to a 5% decline in the fund's managed assets?

Labels: , ,

Friday, August 24, 2007

A Failure of Markets?


As everyone learns halfway through their first principles of economics course, sometimes markets "fail." Many economists argue, however, that the so-called failure of markets is just the reverse: it's the fact that there aren't enough active markets to reach an efficient outcome.

But can there be too many markets? Consider the latest problem with the housing market. In the good old days, when you took out a loan to buy a house, you had to convince the lender that you were creditworthy. After all, if you defaulted on your loan, they would be the one holding the bag. So they had a strong incentive to make sure that you could make your monthly payments.

This isn't the way loans work anymore, thanks to a financial innovation called mortgage-backed securities. What happens is this: when a homebuyer takes out a loan from a bank, the bank bundles that loan with many other loans to create a kind of mutual fund—except that instead of containing stock from hundreds of companies, this fund includes the debts (mortgages) of thousands of homeowners. The idea is simple: as with any mutual fund, even if a single homeowner defaults, it has a negligible effect on the value of the overall fund. The fund's price should reflect the overall risk of all the homeowners rather than the particular risk of any one homeowner.

This notion illustrates the concept of diversification—the fact that although one borrower may have considerable risk, much of that risk is unique, or diversifiable. A well-diversified portfolio of mortgages is only subject to systematic, or non-diversifiable, risk, and its value should reflect that. In other words, with a new kind of security and a market for it, the capitalist system becomes more efficient, because it spreads borrowers' risk across a wide class of investors rather than concentrating it on single lenders (banks, in this case).

So what's wrong with this picture? Think back to the initial lender. They know that they're not making a long-term loan—all they're doing is making a loan that they're then going to sell in this new market. Once they've sold the loan, their exposure to the loan's risk is over. Therefore, they have little incentive to see whether a homeowner can actually afford the payments, because they no longer bear responsibility for the credit decision. Quite the reverse, in fact: they have an incentive to sell the mortgage even if the homeowner cannot afford the payments—for example, by setting a low teaser rate that starts out fixed, but then balloons into a drastically higher variable rate. This has been one root cause of the various scandals about predatory lending practices that have been in the news in the last few months.

In the meantime, those looking to buy a home with no money down might take some advice from Saturday Night Live:


Discussion Questions

1. The crisis in the financial markets has caused some people to lose their jobs and made it harder to apply for a home loan, causing home sales to decline, both of which are very upsetting to Jim Cramer. Indeed, whenever a bubble bursts, lots of people get hurt, or at least find themselves considerably worse off than they were in the artificially inflated world of the bubble. Suppose you were a policymaker overseeing a market in which people were prospering in a way that was unsustainable. What would you do?

2. Cramer practically begged the Federal Reserve to intervene, which it did by lowering the discount rate (though not, presumably, because Jim Cramer asked it to). Does this get at the root cause of the problem? If not, what would?

3. How should society decide who gets to own a home and who does not? What would be the ideal set of institutions that could help achieve the optimal solution to such a problem? Could mortgage-backed securities play an important role in your solution?

Labels: , , , ,

Wednesday, August 22, 2007

Lender of Last Resort


Rising foreclosures among homeowners with subprime mortgages led to unusually tight credit conditions in the banking system last week. Banks became reluctant to provide routine short-term loans to one another for fear that a borrowing bank's balance sheet would be too heavily concentrated in shaky subprime loans. When banks are reluctant to lend to each other, they tend to make fewer loans to businesses and households. Liquidity—the ease with which banks lend to creditworthy costumers and institutions—began to dry up. On August 17, the Fed entered the fray.

In two press releases (here and here), the Fed acknowledged that recent reluctance to lend posed a threat to economic growth, and in a rare move, it encouraged banks with limited credit access to borrow directly from the Fed by lowering the discount rate. The discount rate is the interest rate at which banks borrow from the Fed. The Fed typically sets the discount rate 100 basis points (1 percentage point) above the rate at which banks lend to one another (the federal funds rate). On August 17, the Fed narrowed the spread between the discount and federal funds rates to 50 basis points—thereby reducing the penalty associated with borrowing from the Fed.

By lowering the discount rate, the Fed was fulfilling its function as the lender of last resort. To see why the Fed stepped in, it helps to consider how subprime fears might affect the availability of loans for creditworthy borrowers. Banks, especially large ones, often borrow in order to meet the Fed's reserve requirement (the fraction of the bank's deposits that must be held in reserve rather than being lent out). Without knowledge of which big banks will be affected by subprime foreclosures, other banks that would typically lend some of their excess reserves to big banks at the federal funds rate will be reluctant to do so. If large banks that are short on required reserves find it difficult to borrow reserves in the federal funds market, they will be forced to call in loans, and they'll be hesitant to make any further loans. If banks call in loans and hesitate to lend to even creditworthy people and businesses, loan-dependent consumption and investment spending will fall, leading to slower economic growth, or worse, recession.

By reducing the discount rate, the Fed hopes to increase liquidity in financial markets by making it easier for banks to obtain short-term loans. If the policy works, creditworthy borrowers will not have any trouble obtaining loans for houses, cars, factory expansions, office buildings, and the like. As the subprime crisis subsides, regular credit conditions should prevail and the Fed will be able to return the spread between the federal funds rate and discount rate to its initial value of 100 basis points. If the credit crisis persists in spite of the discount rate move, the Fed will have to take stronger action. Read a recent Bloomberg column by John Berry to find out more.

Discussion Questions

1. In times of financial crisis, the Fed functions as a lender of last resort. More typically, the Fed's role is one of economic stabilization—maintaining low and stable inflation as well as full-employment output. How does the Fed's discount rate decision help it to fulfill its roles as lender of last resort and economic stabilizer?

2. Berry's column mentions "moral hazard" several times. In what way does the Fed's discount rate decision risk moral hazard?

3. Fears about losses from assets backed by subprime mortgages were at the root of much of the financial turmoil of recent weeks. According to Berry's column, how do the estimated losses from the default of subprime borrowers compare to the total assets of the U.S. and Euro-area banking sectors?

4. If the credit crisis continues and economic growth suffers, how might the Fed respond?

5. According to Berry, "…growth may have been damaged even if [credit] markets do settle down relatively soon." How would a temporary credit crisis damage economic growth? Consider the links between lending, housing prices, household wealth, and consumption, as well as the link between lending and investment.

Labels: , , ,

Wednesday, August 15, 2007

Central Banks to the Rescue


World financial markets woke up to a rude surprise on the morning of Friday, August 10. The U.S. subprime mortgage debacle, which was originally thought to be well-contained within a small segment of the U.S. mortgage market, had spread to Europe. This was the straw that broke the camel's back, especially after several hedge funds from highly reputable investment companies collapsed due to heavy reliance on mortgage-backed securities. Hearing this news, bondholders and stockholders were quick to sell their risky holdings in exchange for liquidity (also known as money), which is relatively stable in value.

Aside from the fact that a sudden spike in selling activity in financial markets reduces the paper wealth of investors, it could quite possibly reduce real wealth. First, let's examine the money market effects of a sudden bond and stock sell-off due to a rise in risk aversion. For simplicity, we'll assume there are only three forms of financial assets: bonds, stocks, and money. The sell-off raises the demand for money from MD1 to MD2, as shown in the diagram below.

If the central bank does nothing and fixes the money supply at MS1, the equilibrium interest rate increases from 5.25% to 10%. The economy moves from point A to point B.

Second, let's examine the output market effects of a sudden bond and stock sell-off assuming that the central bank keeps the money supply constant. Higher interest rates mean a higher cost of borrowing for households and firms. Since big-ticket items such as automobiles, factories, and machinery are usually debt financed, consumption and investment spending (on physical capital) will decrease. Because consumption and investment spending are the two most important components of aggregate demand, a lack of central bank intervention will lead to a decline in aggregate demand from AD1 to AD2, as shown in the graph below.

If the central bank does nothing and fixes the money supply at MS1, the equilibrium interest rate increases, which reduces aggregate demand and causes a recession in the short run. The economy moves from point A to point B.

Third, let's examine how central banks around the world reacted to the liquidity hoarding. As the New York Times put it, "central banks around the world acted in unison… to calm nervous financial markets by providing an infusion of cash to the system." The Federal Reserve, along with most central banks, believes that fixing the interest rate is a better policy to maintain price stability and full employment. The Fed performed the cash infusion through of a series of government bond purchases known as open-market purchases, which is another term for the purchase of government bonds by the Fed. The cash infusion, or reserve injection, as textbooks call it, shifts the money supply curve from MS1 to MS2. The reserve injection effectively keeps the interest rate constant and avoids a recession.

If the reserve injection fails to calm financial markets and investors continue to hoard liquidity while selling bonds and stocks, central banks could inject additional reserves into the banking system through additional open-market purchases. The amount of money the Fed can create through purchasing government bonds is nearly limitless.

Read the Federal Reserve's actual press release from Friday, August 10, 2007.

Discussion Questions

1. For the most part, the Federal Reserve's main concern is first and foremost inflation, and secondarily unemployment. Given these two goals, should the Federal Reserve intervene every time the stock market takes a plunge?

2. Most economists believe that a permanent increase in the money supply will generate inflation and make the prices of everyday goods and services higher than they are today. Is this scenario likely given the large reserve injections in the U.S. and world money markets? Why or why not?

3. Some economists believe that markets are highly efficient in the sense that prices and interest rates adjust immediately to guarantee full employment. If this were true, would the Fed's reserve injections have any effect on credit markets or the economy as a whole?

Labels: , ,

Saturday, April 14, 2007

Subprime Primer


Subprime mortgage lenders make home loans to "subprime" borrowers—people who don't have the income, wealth, or credit history to qualify for the traditional lending terms offered to prime borrowers. The recent housing slump pushed multiple subprime lenders into bankruptcy as a rising number of subprime borrowers failed to make their mortgage payments. As subprime lenders go belly-up and subprime borrowers fall on hard times, lawmakers have been quick to find signs of fraud and abuse, and quicker to propose new regulations for the subprime market. Events in the subprime market offer a glimpse of several issues behind the housing market correction in the United States. A recent New Yorker column by James Surowiecki explains the subprime fiasco.

Surowiecki suggests that focusing solely on "predatory lending" practices does not suffice to explain the trouble in subprime markets. He notes that lawmakers cannot consider instances of lender fraud and abuse without also considering the "overambition and overconfidence of borrowers." For example, borrowers who expected sharp increases in home prices used the easy credit offered by subprime lenders to make speculative purchases—buying a home with the intention of selling quickly and for a substantial profit. Other borrowers were enticed by low introductory interest rates and placed too much confidence in the ability of their future selves to pay the mortgage when the low rates expired and higher, adjustable interest rates kicked in.

University of Chicago economist Austan Goolsbee calls for restraint in the regulatory backlash against subprime lending in his New York Times column. Goolsbee focuses on a research paper by three economists: Kristopher Gerardi and Paul Willen from the Federal Reserve Bank of Boston and Harvey Rosen of Princeton. The paper suggests that innovations in the market for home loans, including subprime lending, offer more upside than down. According to the authors, a government crackdown on subprime lending could reduce homeownership opportunities among young people, minorities, and people without a lot of money for a down payment.

Discussion Questions

1. What's a "liar" loan? How did borrowers use such loans to make speculative gambles in the housing market?

2. What's a 2/28 loan? In what ways do consumers tend to "overvalue present gains at the expense of future costs," as Surowiecki suggests? (Think about decisions on whether to consume today or save for the future, or whether to study for an exam or attend a party.)

3. According to Surowiecki, what percentage of subprime borrowers were living in their homes and making monthly mortgage payments at the time the article was written? What does this suggest about the wisdom of an outright ban on "exotic" subprime lending products like the 2/28's?

4. In what way do subprime loans (such as 2/28's) benefit currently low-income households that expect to earn much higher income in the future? How do subprime rates reflect the fact that the expectation of higher future income is not a guarantee of higher future income?

5. What factors traditionally cause homeowners to foreclose? Do recent numbers suggest that subprime lending is the leading cause of foreclosures in the United States?

6. According to Goolsbee, what is the link between the expansion of subprime lending and the growth of homeownership among African-American and Hispanic households?

7. According to both Goolsbee and Surowiecki, the vast majority of subprime borrowers are making their mortgage payments on time. As higher, adjustable rates kick in on home loans with low introductory rates, how might the rates of delinquency (missed payments) and default (failure to pay the loan entirely) change? Suppose the housing market correction continues and home prices continue to fall. How will this affect the bets of speculative borrowers in the subprime market?

8. How would a continued housing slump affect economy-wide consumption and investment expenditures? (Recall that part of investment is residential investment—purchases of new homes and apartment buildings.)

Labels: , , , ,