
Economics Goes Viral
by Ben Resnick
Nothing gets me more excited than getting people with no formal background in economics to see how econ fits in their everyday life. In light of that, imagine my surprise when my good friend Eva Funderburgh, a professional sculptor, wanted to share some economics with me! Apparently she’s not the only one spreading the video above, because, as of this writing, the viral video above created by TV producer/director John Papola and economist Russ Roberts has already received over half a million views on YouTube! Papola and Roberts’ video does a wonderful job creating a new way to take a traditional economic discussion and make it more approachable and entertaining to a much wider audience. In my mind, every economics student should watch the video, and hopefully share it with others as well. For those with a little more time, NPR has put together a very entertaining look at how the project came to be.
The economic thoughts and ideas represented in the video are spot-on, and the lyrics are a fair presentation of the differing schools of thought. While the deeper issues behind the video are much larger than anyone could take on in a single blog post, I do see a place that might deserve a small footnote. I do not mean to take anything away from all the great work that went into this video, but I feel that Keynes’ introduction might deserve a bit of further discussion:
“John Maynard Keynes, wrote the book on modern macro”
Depending on how you define “modern,” an economist who died more than sixty years ago may no longer fit the bill. I think it is totally appropriate to say that Keynes wrote the book on 20th century macroeconomics, but the research frontier of the field is moving beyond his ideals. Starting in the 1970s, some members of the field have explored more complicated models based on critiques of Keynes’ work by Nobel Prize winners Robert Lucas and Milton Friedman, among others. These researchers worry that some of Keynesian economics’ critical assumptions oversimplify the world and make the model invalid. While Keynesian theory is still widely taught today and used by many people advising current policy decisions, some macroeconomists now advocate for models that are built on individual decision making, rather than only analysis based on total expenditure.
These “micro-founded” macro models seek to explain trends in data that defy Keynesian theory. One difference between these schools of thought centers on if household consumption decisions can change in response to fiscal and monetary policies. For example, Keynesian theory assumes that policy does not affect the fraction of net income spent and saved and that the amount of economy-wide consumption will simply change by the product of the tax’s size and the proportion of a household’s after-tax income spent on consumption (often referred to as the marginal propensity to consume, or MPC).
On the other hand, extensions of the micro-founded model proposed independently by Frank Ramsey, Dave Cass, and Tjalling Koopmans suggest that if the government were to lower taxes and give households more money, consumers may choose to change their entire consumption-spending decision based on having larger net income, thus resulting in a new MPC. Whether or not the assumptions made by Keynes are valid (or small enough to be overlooked) is a matter of personal opinion, but as the research horizon of economics extends more than half a century after his writing, it appears that there is still work to be done before macroeconomics can perfectly explain an entire real-world economy.
Discussion Questions:
1. Why should we “fear” booms and busts? Why might booms and busts be good? Is there an “optimal” level of economic fluctuation?
2. Who do the bartenders “Ben” and “Tim” represent in the video? Why are they pouring liquor? What does the liquor represent?
3. The chorus of the rap has Keynes saying “I want to control markets” and Hayek saying “I want to set [markets] free.” Is either of those positions right or wrong in all circumstances? Under what circumstances is more government intervention in markets warranted, and under what circumstances should the government stay out as much as possible?
4. What are the critiques that Keynes offers of Hayek? What are the criticisms that Hayek proposes about Keynes? Does one side seem to have a much stronger argument than the other, or do they both suggest that the theory’s view of the world is still incomplete?
5. Do you think the financial crisis of the past few years was caused by people who thought more like Keynes or more like Hayek? Why?
Labels: Business Cycle, Economic Debates, Macroeconomics
11:41 AM | Permalink | Comments |
Assign Aplia Reading
links to this
post
![]()
![]()
 In a
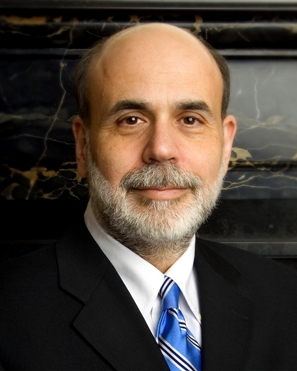
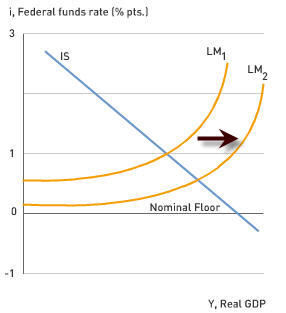
In a 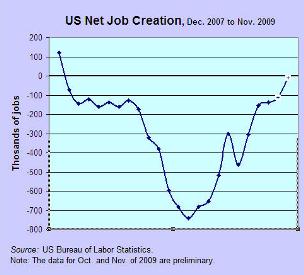 Admittedly, the severe recession has caused significant hardship to billions of people. However, based on economists’ consensus definition of recession, the US economy has been in recovery and thus out of recession for several months now. Indeed, the figure to the right shows a picture of an economy that will most likely experience positive net job creation in coming months. Such positive net job creation has not occurred since the recession began in December 2007. This scenario looks much rosier than could have been hoped for back in the fall of 2008. This is an important reason why Bernanke is expected to be confirmed for another term:

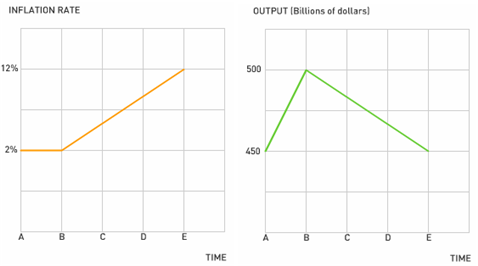
 is the inflation rate:
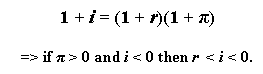


 Subscribe to this blog