Tuesday, October 14, 2008

Do You "Appreciate" Wendy's Super Value Menu?


Despite your possible love for the Double Stack burger found on Wendy's $.99 Super Value Menu, the claim made in a recent Wendy's commercial that the burger "appreciates" in value after being purchased is seriously flawed on many levels according to standard economic theory.

Of the many economic fallacies in the commercial, the immediate one that comes to mind is the mix-up between the notions of appreciation and consumer surplus. Recall from your introductory economics courses that consumer surplus is the difference between what a consumer is willing to pay for a good and what he or she actually pays for it. Obviously, you would never buy something if its valuation to you as a consumer was less than the price you must pay. Therefore, according to standard economic theory, consumer surplus must always be at least zero—though it is typically positive for an individual consumer since it is unlikely that you actually pay the true valuation for any good you purchase.

That said, it is not surprising that the "Student" in the commercial won't accept exactly what he paid for the burger since that is not his true valuation of the good. For example, it's possible that his demand curve is of the following shape:

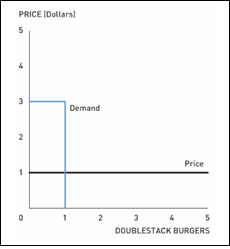
This demand curve implies that Student will pay up to $3 for one Double Stack burger, but then nothing beyond that. This also represents his value for the first Double Stack burger. In this case, Student would receive roughly $2 (= $3 – $1) in consumer surplus by purchasing the Double Stack burger for nearly $1. Obviously, there are an infinite number of possibilities for Student's demand curve, but the one thing we know for certain is that his value of the Double Stack burger is AT LEAST the cost of the burger—but there is nothing preventing his valuation from being higher.

Thus, the idea that Student would not accept a dollar in exchange for his burger has absolutely nothing to do with the proposed "appreciation" of the burger—in other words, Student's valuation of the Double Stack burger has not changed. Rather, this scenario is more reasonably explained by the gains in trade that the buyer receives from purchasing the good at a given price below his private valuation.

Discussion Questions

1. In economics, the notion of a shoe-leather cost—the cost to consumers of actually going to wherever the good is being sold—often plays a role in consumer and producer theory. How would your willingness to accept a dollar for a Double Stack burger change depending on whether you are currently at Wendy's or at home a few miles from the nearest Wendy's?

2. How would this discussion change if Wendy's was able to practice perfect (or first degree) price discrimination?

3. Wendy's often claims that their burger is underpriced and is therefore a value buy. If this were truly the case, why do we not see secondary markets for this good? Is Wendy's really charging the right price?

4. The endowment effect is the idea that people value a good or service more once their property right to it has been established. Is this example of such an effect? Why or why not?

Labels: , , ,

Thursday, September 18, 2008

Financial Market Risks and Negative Nominal T-bill Rates


On September 17, in the immediate aftermath of the Lehman Brothers bankruptcy, the AIG bailout, and the mortgage crisis, negative nominal Treasury bill rates briefly appeared for the first time since January 1940. As Madlen Read points out, a negative nominal Treasury bill rate implies that “investors were willing to take a small loss on the security.”

At first glance, such behavior on the part of seasoned investors seems odd. Why pay more for a security than the amount the US Federal government guarantees to pay you in the future1? One possibility would be that the general price level could fall so that the smaller future payment would represent more purchasing power than the current price of the security. That is, if the price level falls enough, the $1000 payment one receives in several months could buy more than, say the $1000.05 price of the bill could buy today. There is some evidence for this: the US Bureau of Labor Statistics reports that in 2008, on a monthly basis, the percentage change in the CPI was 1.1% in June, 0.8% in July, and –0.1% in August. However, if that is the case, one would still get more purchasing power by holding the $1000.05 in cash through the period of falling prices than by receiving only $1000 in the future. Yet, where can such cash be stored safely?

A more likely explanation is that growing fears of systemic risk have discouraged investors from holding any but the safest financial assets. One example of systemic risk comes from the Reserve Primary Fund, the oldest U.S. money-market fund, which lost two-thirds of its asset value due to its investment in Lehman Brothers’s debt. Wary investors fear that similar losses could threaten other financial institutions. Since US Treasuries are generally considered to be the safest investment possible, there was apparently a rush to invest in these securities. Therefore, an increase in demand for T-bills was likely accompanied by a reduced willingness to sell such securities. The latter represents a decline in the supply of T-bills. Both sides of the market then acted in unison to push up the price of T-bills to such an extent that their sales prices briefly exceeded their maturity values. The maturity value, represented on the graph below by the M=1000 line, is the amount, typically $1000, that the bill specifies will be paid to the owner at maturity.


We can solve for the negative nominal rate mathematically using the following formula:


where M is the bill’s maturity value, PB is the bill’s price, and r is its annualized rate of return on the bill when it is held to maturity.

To illustrate the negative rate phenomenon, suppose that for a $1000 maturity value, the market trades a 3-month T-bill at a price of $1000.05. The nominal rate of return, r, is therefore –.02%.

Negative nominal rates were described here in the context of the Japanese market by Daniel L. Thornton in the January 1999 issue of "Monetary Trends." In the article, Thornton states that “investors are willing to accept a negative nominal return on a risk-free asset because holding it is cheaper and less risky than transporting and storing cash.” So it seems that for one day at least, investors were willing to lock in a nominal loss on a safe asset rather than risk leaving cash in financial institutions.

Discussion Questions
1. The Lehman Brothers bankruptcy, the AIG bailout, and the mortgage crisis have apparently shaken investor confidence in financial institutions. Do you think their fears are justified? Do you believe that these financial events have had an impact on your life? If yes, how, and if not, then why not?

2. How might forecasts of a falling general price level in the near future help to explain investors' willingness to accept negative nominal T-bill rates?

3. The dramatic shifting of funds into the safety of Treasuries implies that funds left other sectors. With many financial sites available, you can find information the returns on various financial assets online. Which investment sectors had the largest declines on Sept. 17, 2008? Which investment sectors had the largest gains on that day? How would you explain the results that you found?
-------------------------------------
1 Recall that T-bills have zero coupons which means that they make no payment until the maturity date.

Labels: , , , , ,

Tuesday, July 01, 2008

Sacking Mugabe


The path to growth remains elusive for many of the world's economies. Prescribing effective growth policies is exceedingly difficult. The unique features in each of the world's economies defy formulaic approaches to growth—it's not necessarily clear that Japan's path will work for Cambodia. Economic history offers a bit more clarity when it comes to what won't work. Of the more recent episodes of economic collapse, Zimbabwe's is perhaps the starkest. The Mugabe regime's mismanagement of the Zimbabwean economy reads like a step-by-step guide to economic ruin.

In 2000, Zimbabwe's autocratic ruler, Robert Mugabe, implemented a clumsy and often violent land redistribution program. Mugabe forcefully seized white-owned farmland and gave it to black farmers unfamiliar with commercial farming practices. The absence of any cooperative knowledge transfer between white and black farmers led to a precipitous fall in agricultural output. The failure of the agricultural sector caused a severe contraction in overall economic output, creating massive unemployment. The collapsing economy sapped Mugabe's regime of the tax revenues necessary to pay soldiers and finance government outlays. An autocrat's reign is only as secure as his army is brutal—hungry, underpaid soldiers aren't much for intimidating political opponents or scaring the populace into submission. To maintain his government's outlays, Mugabe turned to borrowing. Of course, the loans would eventually need to be repaid. Lacking the tax base to repay the loans, the government resorted to the capstone of many economic disasters: printing money.

The results were predictable: hyperinflation reached roughly 4 million percent per year as of June 2008. At these levels of inflation, even the most mundane daily transactions involve considerable uncertainty and frustration. Mugabe's response to the hyperinflation that he himself initiated could not have been worse. The government imposed price ceilings, threatening to jail shop owners if they charged more than the official price. The price ceilings led to massive shortages of necessities like bread and milk. Many firms shut down production, escalating an already high unemployment rate.

You don't have to be an economist to recognize the first step to improving Zimbabwe’s economy: get rid of Mugabe. But removing Mugabe from power is easier said than done. Opposition presidential candidate Morgan Tsvangirai gave it an impressive go during this year's elections, but widespread violence against opposition supporters caused Tsvangirai to withdraw from the presidential run-off. At this point, Mugabe remains president.

Discussion Questions

1. Mugabe is 84 years old—why doesn't he just step down? Charlayne Hunter-Gault's article in The Root suggests that Mugabe has strong incentives to maintain his grip on power given the fate of other overthrown tyrants. Hunter-Gault raises an interesting dilemma for freedom-lovers all over the world: we want to get rid of brutal dictators, but the dictators may do everything they can to retain power precisely because they fear what we'll do to them once they're out of office. Should we offer Mugabe amnesty just to get him to step down?

2. In a recent Wall Street Journal editorial, former World Bank president and U.S. Deputy Secretary of Defense Paul Wolfowitz suggests a way to pressure Mugabe out of office. Wolfowitz calls on the international community to very publicly declare promises of aid and debt relief for Zimbabwe under the condition that Mugabe is removed from office. Do you think this strategy would succeed?

3. Mugabe's land redistribution program was catastrophic for Zimbabwe's economy, but as this NPR story points out, several neighboring countries attempted to benefit from the displacement of white farmers in Zimbabwe. How could the Zimbabwean government have balanced the goals of efficiency of the farming sector and equity for the black population that suffered a history of oppression by a ruling white minority?

Labels: , , ,

Monday, November 26, 2007

The Phillips Curve and the Federal Reserve


The Phillips Curve is a concept often covered in introductory macroeconomics. However, in some economic and political circles, the concept is considered outdated and useless. Some economists and commentators, such as Lawrence Kudlow, might go as far as to say that the Phillips Curve is dead. Why does the Phillips Curve command such controversy? Is it as irrelevant as some economists claim?

The traditional Phillips Curve is the trade-off between the inflation rate and the unemployment rate. Many economists in the 1960s thought that the Federal Reserve or Congress could permanently lower the unemployment rate by increasing the inflation rate. The trouble is, the traditional Phillips Curve violates one of the central tenets of economics: the classical dichotomy. According to the classical dichotomy, nominal variables do not affect real variables. Consider a simple example:

I hold a bag of apples that weighs 5 pounds. The weight (i.e., the force exerted on my arm) is a real variable and the unit of measurement (i.e., pounds) is a nominal variable. Suppose the U.S. government passes a new law that says all measurements must conform to the metric system. Now the same bag of apples weighs 2.27 kilograms. Notice that the nominal variable (how the weight is measured) has absolutely no effect on the real variable (the force exerted on my arm).

The traditional Phillips Curve is in direct contradiction of the classical dichotomy. The Phillips Curve implied that the government could effectively reduce the unemployment rate (a real variable) by changing how fast overall prices are growing in the economy (a nominal variable). Though the traditional Phillips Curve held up well in the 1960s, the 1970s would usher in the downfall of the traditional Phillips Curve.

In the 1970s, the trade-off between the unemployment rate and the inflation rate seemed to fall apart. The United States experienced soaring overall prices and rising unemployment. In other words, there appeared to be an upward-sloping relationship between the inflation rate and unemployment rate. Due to this fact, many economists declared the Phillips Curve to be dead.

Due to the abrupt change in the correlation between inflation and unemployment, several theories were proposed as alternatives to the Phillips Curve. These theories include the Real Business Cycle (RBC), Rational Expectations, and Monetarism. Often times these theories are called “New Classical” economics because they promote the classical dichotomy.

Under heavy pressure from competing theories and empirical evidence, a new school of thought known as “New Keynesian” economics sought microeconomic foundations for the Phillips Curve. Edmund Phelps, the Nobel Laureate in 2006, augmented the traditional Phillips Curve by adding the critical role of expectations. Under the expectations-augmented Phillips Curve model, a trade-off between inflation and unemployment does exist but only in the short run. According to the model, inflation expectations adjust to return the economy to its natural rate of unemployment (i.e., an unemployment rate consistent with non-accelerating inflation). George Akerlof, the Nobel Laureate in 2001, provided behavioral explanations for the trade-off. Subsequent works by economists, such as David Romer and Greg Mankiw, provided additional microeconomic foundations for a short-run trade-off.

Through all the intellectual turmoil, most economists agree on the following:

1. There is a short-run trade-off between the inflation rate and the unemployment rate.
2. In the long run, the inflation rate adjusts to restore the natural rate of unemployment. Hence, policy makers cannot permanently push unemployment below its natural rate by permanently increasing the inflation rate.

How well does the modern Phillips Curve describe the real world, and do practitioners actually use the modern Phillips Curve? James Stock and Mark Watson, authors of a famous introductory econometrics textbook and well-respected econometricians, empirically showed that the modern Phillips Curve bested all other alternatives in terms of forecasting inflation. Ben Bernanke, chairperson of the Federal Reserve, professed publicly here and here on the importance of the modern Phillips Curve in the Fed's inflation forecasts, which ultimately influence monetary policy.

The Phillips Curve has changed over the past 40 years, but it is very much alive as a reference for monetary policymakers.

Discussion Questions:

1. Go to the Bureau of Labor Statistics web site and pull data on the national unemployment rate and the CPI inflation rate. For your convenience, I have included the spreadsheet here. Does there appear to be a trade-off between inflation and unemployment between January 2001 and December 2001?

2. Does there appear to be a trade-off between January 1997 and October 2007?

3. Why do you think an increase in the inflation rate decreases the unemployment rate in the short run? Why do you think a decrease in the unemployment rate increases the inflation rate in the short run?

Labels: , , , ,

Monday, November 19, 2007

Inflation Targeting Lite


A central bank controls the economy's money supply—the growth of which ultimately determines the growth of the economy's price level (the inflation rate). Many of the world's central banks publicly announce inflation targets. An inflation target is a specific rate (such as 2%) or a range of inflation rates (such as 1%–3%) that the central bank will try to achieve over time. By publicly announcing and consistently hitting an inflation target, these central banks hope to enhance their credibility and anchor people's expectations of future inflation. If people believe a central bank's commitment to low and stable inflation to be credible, they will expect future inflation to be low and stable—feeding a virtuous cycle of low inflation, low inflation expectations, and slow increases in overall prices and nominal wages. Confidence that inflation will remain low reduces the uncertainty surrounding saving and investment decisions, fostering a favorable climate for economic growth.

The Federal Reserve System (the Fed) is a notable holdout on inflation targeting. Most people understand that one of the Fed's policy mandates is price stability, or low and stable inflation, but the Fed has never publicly described exactly what "low and stable inflation" means. Fed chairman Ben Bernanke recently announced a change in Fed practices that will move U.S. monetary policy a bit closer to the inflation targeting ways of the rest of the world. The Fed will now publish three-year economic forecasts four times per year (rather than two). More importantly, the Fed will tell us how it thinks economic output, unemployment, and inflation will take shape over the next few years based on its application of monetary policy. The Fed will essentially say, "Here's what we expect inflation to be if we implement sensible monetary policies over the next three years."

That's not quite the same as explicitly stating a target, but it sounds pretty similar. The American public will now have a better sense of the inflation rate that the Fed seeks to restore in the event of economic disturbances that move the inflation rate away from the Fed's projection. Read this New York Times article or Bernanke's speech to learn more about the Fed's efforts to increase transparency.

Discussion Questions

1. Many central banks face a sole mandate of price stability, whereas the Fed faces a dual mandate of price stability and full employment. Over which part of its dual mandate does the Fed exercise more influence, price stability or full employment?

2. Chairman Bernanke, an advocate of inflation targeting, mentions in his speech that "a superficial drawback of inflation targeting is its very name, which suggests a single-minded focus on inflation to the exclusion of other goals." He goes on to point out that most central banks practice flexible inflation targeting that allows them to focus on other policy goals. The former chairman of the Federal Reserve, Alan Greenspan, was generally opposed to inflation targeting. As the Times article points out, Greenspan felt that "explicit public commitments would hobble the Fed's ability to respond nimbly to unexpected developments." Do you think a publicly announced inflation target would help or hamstring the Fed's dual mandate?

3. Monetary policy has become more transparent over the past couple of decades. The Fed's latest move to publicly offer more frequent and in-depth economic analysis is a continuation of this trend. How will the additional information help households and firms make economic decisions and plan for the future? How can monetary policy become more transparent over time? Should it? For example, would televised meetings of the Federal Open Market Committee (FOMC, the Fed's policymaking arm) help firms and households to make better saving and investment decisions?

Labels: ,

Thursday, September 13, 2007

Interest Rates and Inflation


The central bank of China has been combating surging inflation, which recorded an 11-year high of 6.5% last month. The inflation has contributed not only to the erosion of purchasing power, but also to negative real interest rates in China. Recall that

Real Interest Rate = Nominal Interest Rate – Inflation Rate

While nominal interest rates are never negative, real interest rates will be negative if the inflation rate exceeds nominal interest rates.

Interest rates play a dual role in the economy. On the one hand, they determine the interest payments banks make to depositors; on the other, they determine the interest payments borrowers make to banks. Since the interest rate is the return on deposits, negative real interest rates imply a loss of purchasing power if people deposit money into banks. This will discourage people from saving and encourage them to withdraw their funds for current consumption and investment.

At the same time, negative real interest rates mean that the cost of borrowing is low or even negative. Because of this, negative real interest rates can boost aggregate demand, or total spending, and fuel a bubble in the stock market. As observed by Dong Zhixin of China Daily, low interest rates have played an important role in fueling the Chinese stock market, with people withdrawing or borrowing from banks to buy stocks.

In August, the People’s Bank of China raised nominal interest rates for the fourth time this year in an effort to cool the economy. This will boost real interest rates and raise the cost of borrowing at any given inflation rate. The higher cost of borrowing will hopefully curb excessive spending and ultimately reduce inflation.

Discussion Questions

1. Is it possible or even desirable for the Chinese government to fine-tune the real interest rate by adjusting the nominal interest rate? Why?

2. China's currency, the yuan, is fixed to the U.S. dollar within a narrow band in the foreign exchange market. What impact do rising interest rates in China have on the exchange rate?

Labels: , ,

Friday, July 27, 2007

And You Think Low Prices Are Always Best?


With persistent hyperinflation, money has become worthless in Zimbabwe. The official inflation rate in May was 4,500%, but according to estimates, the real rate had already reached 9,000%. In response to the continuously rising prices, President Mugabe of Zimbabwe ordered the prices of all commodities be cut by at least half. This type of price control by the government is referred to as a price ceiling, with the selling price set below the equilibrium price. Let's examine the effect of a price ceiling using the supply and demand diagram to the right.

Let Pe and Qe be the equilibrium price and quantity of a commodity. A price ceiling that regulates the commodity to be sold at Pc leads to an increase in quantity demanded to Qd. At the same time, producers reduce the supply of the commodity at Pc, thereby lowering the quantity supplied to Qs. Hence, there will be excess demand, or shortage (Qd – Qs) for the commodity. This is exactly what the Zimbabweans are experiencing in the wake of Mugabe’s price cuts. Many commodities were swept from the shelves and disappeared from sale as producers refused to supply more at the regulated price.

The story does not end here, though. From the supply and demand model, we see that at Qs, some people are willing to pay as much as Pb to obtain the commodity. Therefore, informal markets emerge with people buying and selling commodities at prices much higher than the regulated or market equilibrium prices.

Read Chris McGreal’s article in The Guardian to learn more.

Discussion Questions

1. According to the article, what might be the reasons behind President Mugabe’s price cuts?

2. Who stands to benefit from the price controls in Zimbabwe? Who stands to lose?

3. What could the Zimbabwean government do to save the economy?

Labels: , ,

Monday, April 16, 2007

Inflation, Taxes, and Saving


What's so bad about inflation? Economists typically break the discussion of inflation costs into two categories: the costs of low, predictable inflation and the costs of high, unpredictable inflation.

Economies with high, unpredictable inflation tend to experience slower growth rates. With unpredictable inflation, borrowers and lenders cannot be sure what the real interest rate will turn out to be over the course of a loan. This uncertainty makes people less likely to lend their money (for example, by buying bonds), which in turn leads to less investment and a slower rate of long-term economic growth.

If the inflation rate is low and stable, it imposes fewer economic costs. As prices rise, one dollar will purchase fewer and fewer goods and services over time. This slow erosion of purchasing power encourages people to invest their savings in interest-bearing accounts, keep more of their money in the bank and less in currency, and generally spend more time managing their assets than they would in the absence of inflation; but savings rates are pretty much unaffected… right?

Not quite. Even if inflation is relatively tame, it can still have some major consequences on savings rates because of the way investment gains are taxed. In a recent Slate column, Henry Blodget argues that the design of the tax system in the United States discourages saving—in part because portions of the tax code do not attempt to correct for distortions caused by inflation. Read Blodget's article to find out more about the tax treatment of savings and the tax distortions from inflation.

Discussion Questions

1. According to Blodget, what non–tax-related factors explain the negative U.S. personal savings rate in 2005 and 2006?

2. Suppose you purchase a $1,000 T-bill that offers a 4% nominal rate of return. The inflation rate is 3% per year and you're in the 15% tax bracket.
  • What is the before-tax nominal return on your T-bill in the first year?
  • As Blodget notes, the U.S. government treats the return on your T-bill as income and assesses a 15% tax on the nominal return from your T-bill. How much tax would you pay on your nominal return from the T-bill?
  • By how much does inflation erode the purchasing power of your nominal return?
  • What is the after-tax, inflation-adjusted return on your T-bill in the first year?
3. What are the differences between taxes on gains from stocks and taxes on gains from holding T-bills? Suppose you purchase a share of stock that immediately doubles in value. What tax event will you trigger in the event that you sell the share of stock at its new, higher price?

4. How does low, predictable inflation distort savings decisions when the government taxes the nominal gains on savings vehicles such as stocks and bonds?

5. What are Blodget's suggestions for making the tax system less hostile to saving? How does he suggest taxing the capital gains from the sale of stocks? How would he treat the interest earned on T-bills? Can you think of other changes to the tax system that would encourage rather than discourage saving?

Labels: , , ,

Thursday, March 01, 2007

Inflation Gone Wild


With an annual inflation rate of 1,600%, Zimbabwe currently holds the world title for fastest-increasing prices. As the late Milton Friedman put it, “Inflation is always and everywhere a monetary phenomenon. To control inflation, you need to control the money supply.” The inflation cure seems simple to understand from a textbook perspective: drastically cut back the money supply in order to lower the expected inflation rate.

Unfortunately, the cure might be worse than the disease. With the current unemployment rate at 80%, drastic cuts in the money supply could increase unemployment and cause a coup d'état before the expected inflation rate falls. The monetary contraction is inevitable if Zimbabwe wishes to tame the inflation monster, and the International Monetary Fund has urged the government to liberalize its exchange rate regime as a means to cushion the unemployment effects.

In order to understand the IMF’s position on Zimbabwe’s exchange rate, we must examine how maintaining an overvalued currency might contribute to soaring inflation, and how floating the currency might provide relief to both inflation and unemployment.

The graph on the left shows the market for Zimbabwean dollars. Assume that the government fixes the exchange rate at E1. A fixed exchange rate is the official value of the currency despite fluctuations in supply and demand. Initially, the official value equals the market value where D1 intersects S1 (point A). Then, due to unsustainable fiscal deficits and government land reforms that usurp private property, foreign investors flee Zimbabwe. Consequently, the demand for Zimbabwean dollars decreases from D1 to D2.

If Zimbabwe were under a floating exchange rate regime, the fall in demand for Zimbabwean dollars would result in the depreciation of the currency from E1 to E2 (point B). But because Zimbabwe’s government insists on a fixed exchange rate regime, the fall in demand for Zimbabwean dollars will cause a surplus of Zimbabwean dollars (Q1 - Q2). At point C, the currency is considered overvalued because the official value is greater than the market value. In order to eliminate downward pressures on the currency, Zimbabwe will instruct its central bank to buy the surplus of Zimbabwean dollars (and sell U.S. dollars), which will return the market to point A. Zimbabwe's central bank will eventually deplete its U.S. dollar reserves as the economy deteriorates from questionable domestic policies, and will borrow U.S. dollars in order to maintain the fixed exchange rate.

Since the loans are denominated in U.S. dollars, Zimbabwe must make periodic payments in U.S. dollars or face getting cut off from all sources of international capital. Due to disastrous domestic policies, the government has little tax revenue to make those periodic payments, and the only way to service their international debts is to print more money, just as Germany did after World War I. As the central bank expands the money supply to pay international debts, inflation increases, which places additional downward pressure on the Zimbabwean dollar: as foreigners demand less and less of the failing currency, Zimbabwe has to print more and more money, and sooner or later, everything will spin out of control.

One solution is to eliminate the fixed exchange rate regime altogether and allow the Zimbabwean dollar to float freely. If the currency were allowed to float today, its value would fall tremendously, which would stimulate exports and reduce imports. The graph on the right shows that as the exchange rate falls from E1 to E2, net exports increase from NX1 to NX2. A floating exchange rate would boost job creation as the central bank institutes the tough medicine of curing inflation by drastically reducing the money supply.

Discussion Questions

1. If the fixed exchange rate regime were eliminated, what would happen to the size of Zimbabwe's international debts in terms of Zimbabwean dollars? Would it increase or decrease?

2. The central bank has recently declared inflation illegal. How do price controls affect domestic markets like those for corn, wheat, electricity, and labor?

3. This analysis assumes that Zimbabwe's reduction in real GDP is due to domestic policies such as unsustainable fiscal deficits and poor private property rights. How might hyperinflation directly contribute to higher unemployment?

Labels: , , , , , ,

Monday, August 21, 2006

How to Cure Inflation


Argentina is no stranger to inflation and has suffered frequent periods of devastating inflation since 1945. Despite recent praise from the International Monetary Fund for its economic growth, Argentina currently suffers from a 12.3% inflation rate (compared to only 4% in the United States).

Milton Friedman, winner of the 1976 Nobel Prize in Economics, compares inflation to alcoholism in his PBS series, Free to Choose:
Inflation is just like alcoholism, in both cases, when you start drinking or when you start printing too much money. The good effects come first; the bad effects only come later. That's why, in both cases, there is a strong temptation to overdo it, to drink too much and to print too much money. When it comes to the cure, it's the other way around, when you stop drinking or when you stop printing money the bad effects come first and the good effects only come later. That's why it's so hard to persist with the cure.
Source: Free to Choose, Volume 9 of 10, How to Cure Inflation (26:40)

A simple aggregate demand (AD) and aggregate supply (AS) diagram offers great insight into Friedman's analogy and Argentina's inflation woes. The following AD-AS diagram is based on a paper by Professor David Romer. The model might be slightly different from the AD-AS diagram in your textbook.

First, let's look at the assumptions in the model. The aggregate demand curve (AD) assumes that the central bank raises the interest rate in order to combat inflation. For example, if the inflation rate increases, then the central bank will raise the interest rate to reduce consumption and investment, thereby lowering output. The short-run aggregate supply curve (SRAS) represents the inflation rate. The long-run aggregate supply curve represents the output level where the inflation rate has no tendency to change. The long-run aggregate supply curve is often referred to as potential output or full-employment output.

Second, let's look at the short-run effects of an increase in the money supply. In the short run, economists assume that the inflation rate is temporarily fixed. The short run might be a period of 1 day, 1 month, or 1 year. There is no consensus about how long the short run lasts. If the central bank expands the money supply, then the interest rate falls. A fall in the interest rate stimulates consumption and investment spending which shifts the aggregate demand curve to the right from AD1 to AD2.The good effects come first--in the short run, it seems as though the economy has benefited from a higher quantity of money. Output increased from $450 billion to $500 billion which creates more jobs without increasing inflation.

Third, let's look at the long-run effects of an increase in the money supply. The output level at time B is not a sustainable amount of output because $500 billion exceeds full-employment output, which is only $450 billion. An output level above the full-employment output necessarily means that resources in the economy are being over-utilized. Inflation expectations increase in the long run as a consequence of over-utilization, which causes the inflation rate to gradually increase from SRAS1 to SRAS2.

As the inflation rate increases, the central bank frantically tries to contain inflation by increasing the interest rate which reduces output gradually from $500 billion to $450 billion.

The bad effects come later
--in the long run, the monetary expansion leads to soaring inflation without creating any new jobs. Historically, a high inflation rate is associated with lower rates of long-run economic growth. High inflation rates create uncertainty about future production costs and the future purchasing power of the currency. As a result, high inflation tends to discourage saving and investment--both important determinants of long-run economic growth.

The following graphs show the time path for the inflation rate and output between time A and time E. Notice that the good effects occur between time A and B, but the bad effects occur between times B and E.1. Despite the central bank's attempts to reduce inflation between times B and E, the inflation rate inevitably still increases. What can explain this?

2. Suppose the economy is at time E. What must Argentina's central bank do in order to reduce the inflation rate from 12% to 2%? Will this be politically popular?

3. Using the AD-AS model, explain what Friedman means by "When it comes to the cure, it's the other way around, when you stop drinking or when you stop printing money the bad effects come first and the good effects only come later. That's why it's so hard to persist with the cure."

Labels: , , , ,

Thursday, August 10, 2006

Oil Shock, Part II: The Macroeconomic View


Microeconomists examine how the BP oil field shutdown affects oil prices, the behavior of automobile drivers, and profitability of particular industries. Oil Shock, Part I showed that the oil field shutdown raises the price of oil which reduces the profitability of many firms.

Macroeconomists, on the other hand, examine the economy-wide effects such as how a sharp rise in oil prices affects inflation, output, and unemployment. Suppose that the BP oil field shutdown causes the inflation rate to increase from Inflation Rate 1 to Inflation Rate 2 because firms try to pass on some of the higher input prices to higher output prices. In order to simplify the analysis, assume that full-employment output is constant at FE Output. Full-employment output, or potential output, is the amount of output that the economy produces when all the resources in the economy are efficiently utilized.

If the BP oil field shutdown increases the inflation rate, then the Fed will pursue a tight (anti-inflation) monetary policy which raises interest rates. Higher interest rates would reduce consumption and investment, causing output to fall. An output gap opens up as actual output falls below full-employment output in the short run. In the long run, the output gap will cause the inflation rate to fall back to its initial state. As the inflation rate falls in the long run, the Fed will pursue loose monetary policy and return the economy back to full employment.

A fall in output usually leads to an increase in the unemployment rate as firms cut back on production of goods and services and lay-off workers.

If the BP oil field shutdown leads to an inflation shock, then interest rates will rise, output will fall, and unemployment will increase in the short run.

However, inflation's tyranny does not end there. A higher inflation rate also destroys wealth in terms of stocks and bonds. An increase in the interest rate also reduces the price of stocks and bonds (archived entry: Why Does Bernanke's Small Talk Move Markets?)

1. Financial markets are very sensitive to inflation data. Suppose the Bureau of Labor Statistics reports that the inflation rate increased from 2% to 4%. Why would stock and bond prices fall as soon as the report is released, but before the Fed actually changes any interest rates?

2. The Fed, in its last FOMC meeting on August 8, 2006, kept the federal funds rate unchanged at 5.25%. Could this mean that the Fed does not consider the BP oil field shutdown an inflation shock?

3. Inflation expectations matter. The Fed's inflation-fighting credibility has been strong since Paul Volcker (the Federal Reserve Chairman from 1979 to 1987). Suppose consumers and producers always expect the Fed to return the economy to a target inflation rate--would higher oil prices require the Fed to raise interest rates (or raise them by as much)?

Labels: , , ,

Tuesday, July 25, 2006

A Tale of Two Dragons: China's Trade Surplus and Inflation


In Chinese mythology, dragons can bring prosperity or destruction to villages and empires. China currently faces two dragons: the trade surplus that brings prosperity to Chinese manufacturers and urban workers, and inflation, which threatens China's price stability. Bloomberg reports that China's trade surplus might be fueling China's inflation problems.

One possible explanation is that the increase in the trade surplus outpaces the increase in potential output. Net exports are one component of aggregate demand in China. An increase in net exports pushes the aggregate demand curve to the right. Potential output increases as China utilizes more of its work-force (labor-intensive growth) and increases its capital stock (capital-intensive growth). The graph below shows that the increase in potential output (LRAS1 to LRAS2) is less than the increase in aggregate demand (AD1 to AD2). Whenever the increase in aggregate demand exceeds the increase in potential output, inflation is sure to follow (for example, from SRAS1 to SRAS2).
1. China maintains a relatively fixed nominal exchange rate between the yuan and the U.S. dollar (nominal exchange rate = 8 yuan per U.S. dollar). The real exchange rate is the nominal exchange rate times the ratio between the U.S. price level and the Chinese price level. The real exchange rate also represents the cost of U.S. goods and services relative to Chinese goods and services. How does an increase in China's inflation rate affect the real exchange rate?

2. How does an increase in China's inflation rate affect the trade balance between the United States and China?

3. The People's Bank of China often keeps its nominal interest rate equal to the United States' nominal interest rate in order to maintain the fixed nominal exchange rate (interest rate parity). Can the Bank of China choose to fight inflation and keep the nominal exchange rate fixed?

Labels: , , , , ,